Litecoin Price Prediction: LTC is on the brink of a massive breakout to $180 as whales go into buying spree
- Litecoin price is bounded inside a descending triangle pattern on the 12-hour chart.
- Whales have been accumulating a lot of LTC in the past month, increasing buying pressure.
- The MVRV chart shows Litecoin is in the buy-dip zone.

Litecoin has been trading downwards since its peak of $185 on January 10 but has established a robust support level at $122. The digital asset seems to be on the verge of a breakout as several metrics have turned positive for LTC.
Litecoin price could quickly jump towards $180 if this level cracks
On the 12-hour chart, Litecoin price has established a descending triangle pattern, which is on the verge of a breakout. If LTC can climb above $135, it will see a 35% jump towards $180 in the mid-term.
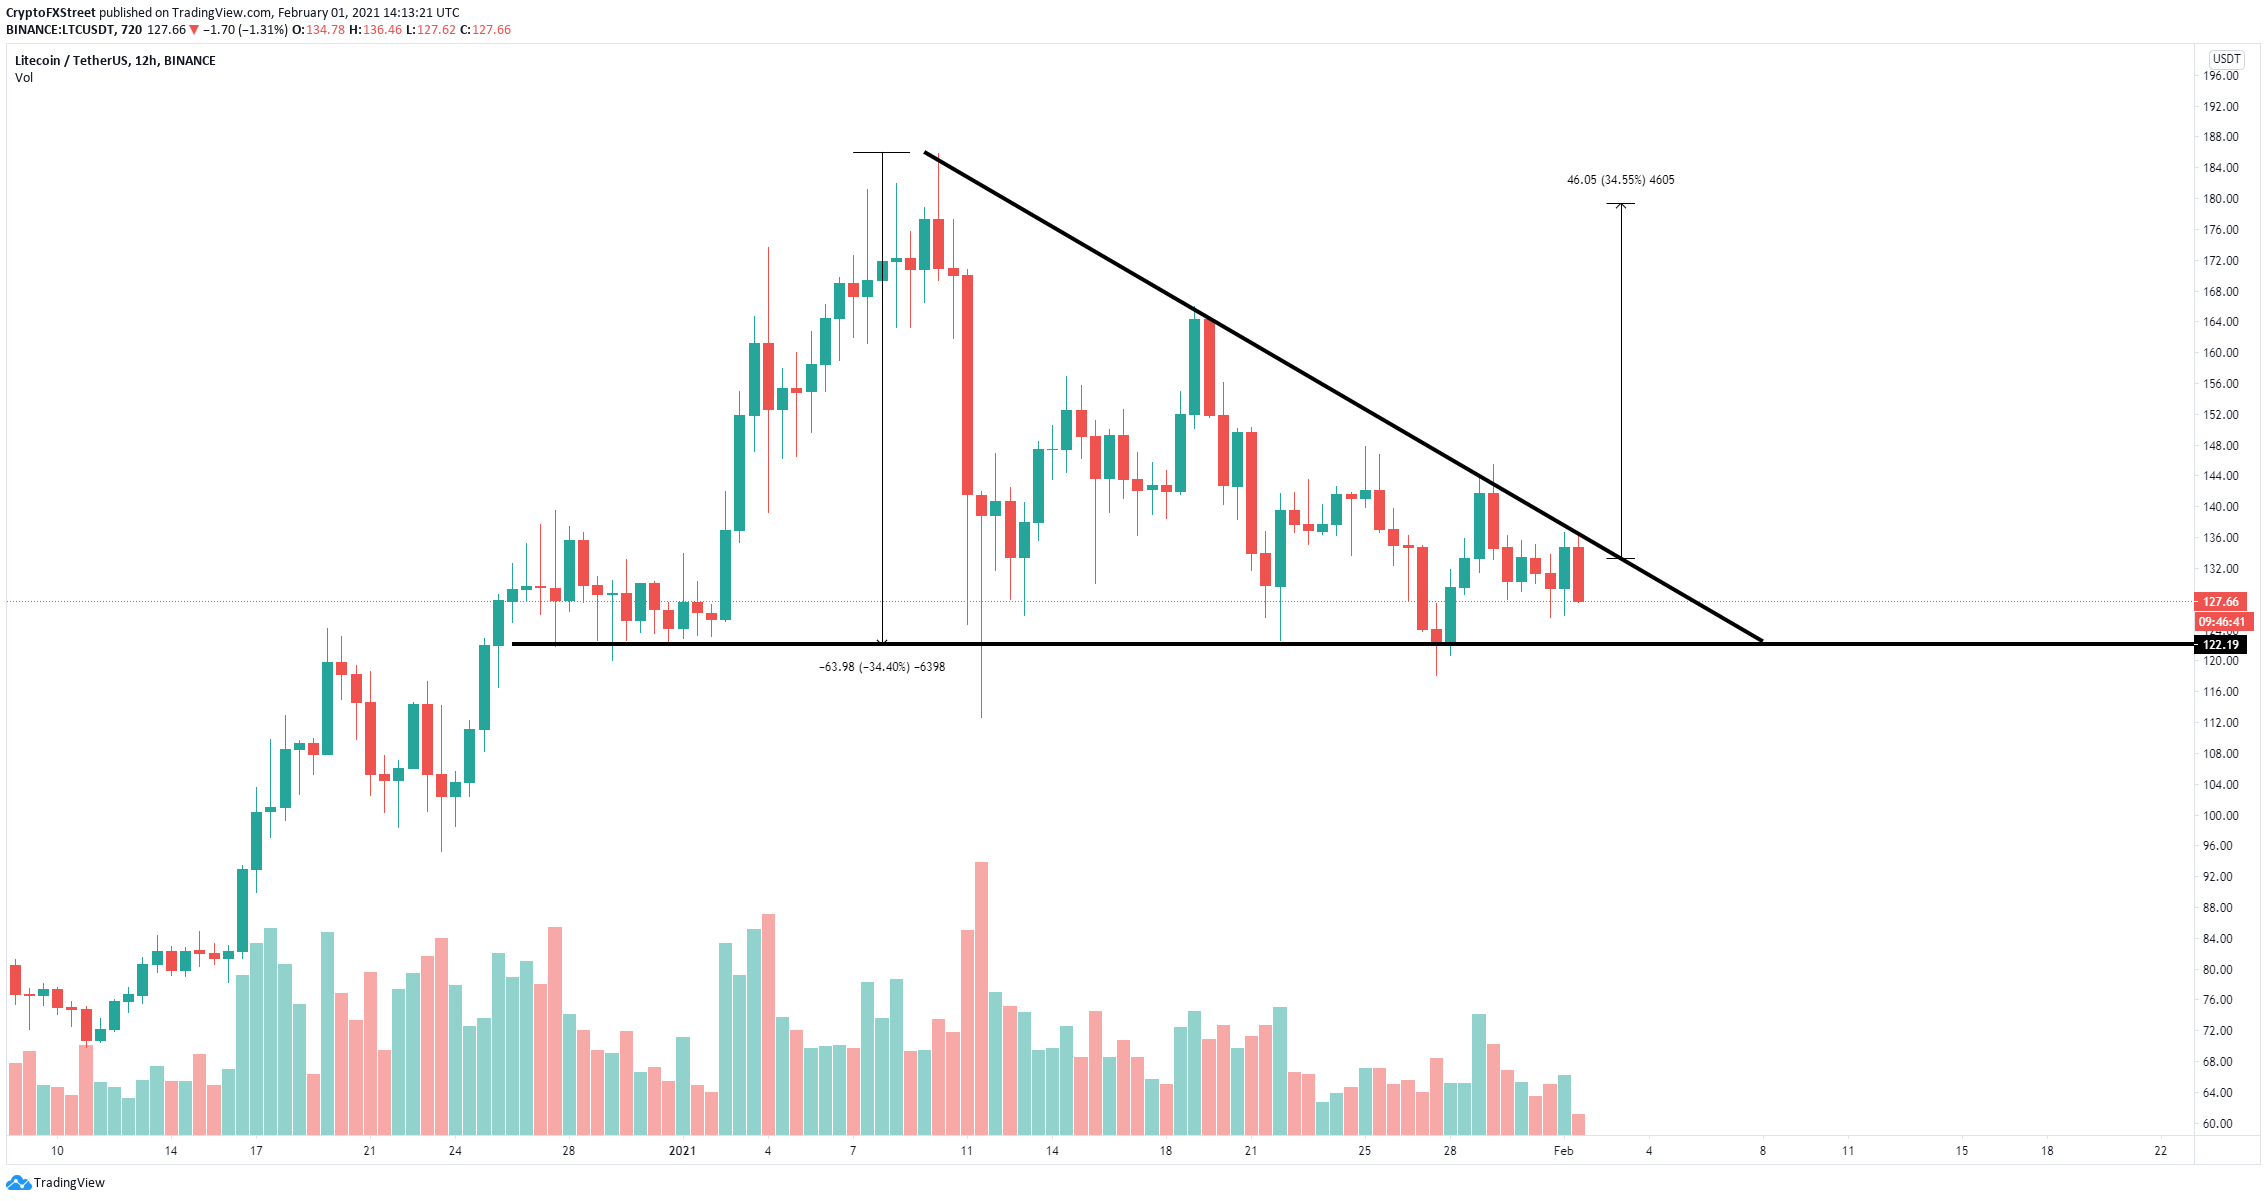
LTC/USD 12-hour chart
Since January 19, six more whales have joined the Litecoin network holding between 100,000 and 1,000,000 coins ($12,800,000 and $128,800,000), which shows they believe LTC price is bound to rise higher.
%20[15.15.12,%2001%20Feb,%202021]-637477894023696267.png)
LTC Holders Distribution
Additionally, the MVRV (30d) indicates that Litecoin is currently inside the dip-buying zone, which usually leads to a significant breakout and uptrend in the upcoming days.
%20[15.21.54,%2001%20Feb,%202021]-637477894063230990.png)
LTC MVRV (30d) chart
Despite Litecoin price going down for the past several days, the number of daily active addresses has continued to rise. Similarly, its social volume also had significant spikes in the past week, adding more credence to the bullish outlook.
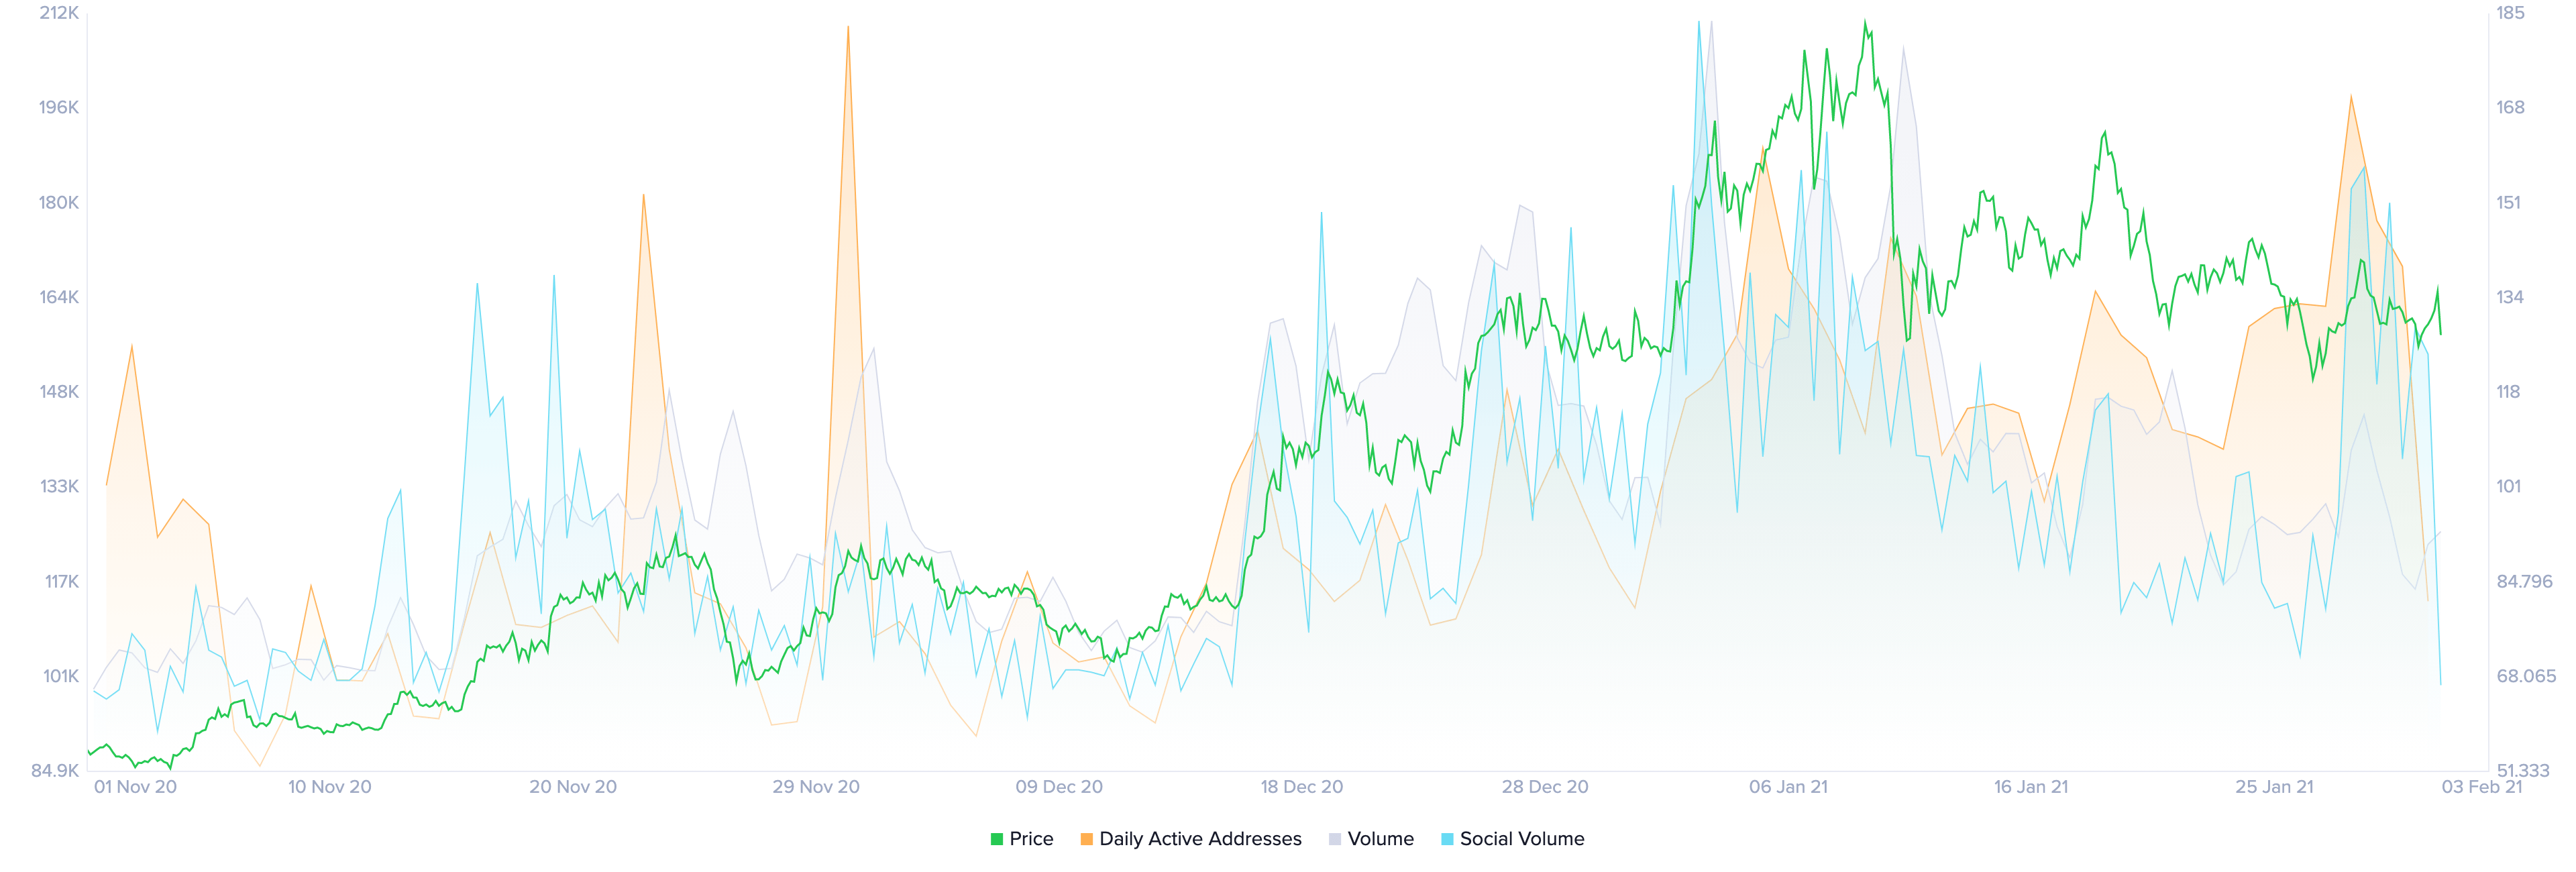
LTC social volume and active addresses chart
However, the In/Out of the Money Around Price (IOMAP) chart shows steep resistance ahead of $128 until around $143. The most significant support area is located between $112 and $116, with 756,000 LTC in volume.
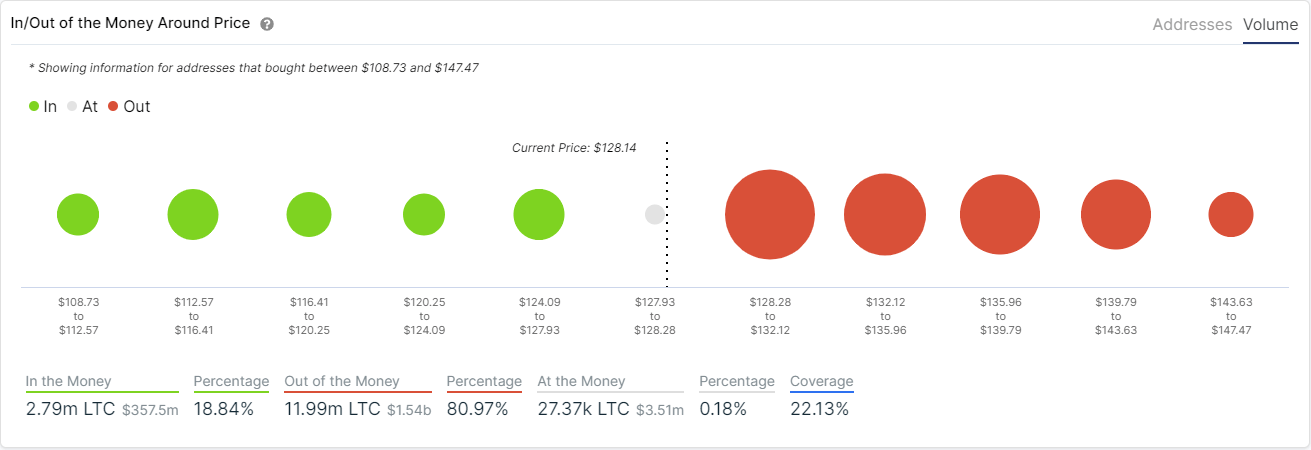
LTC IOMAP chart
This support area between $112 and $116 coincides with the lower support trendline of the 12-hour chart descending triangle pattern.
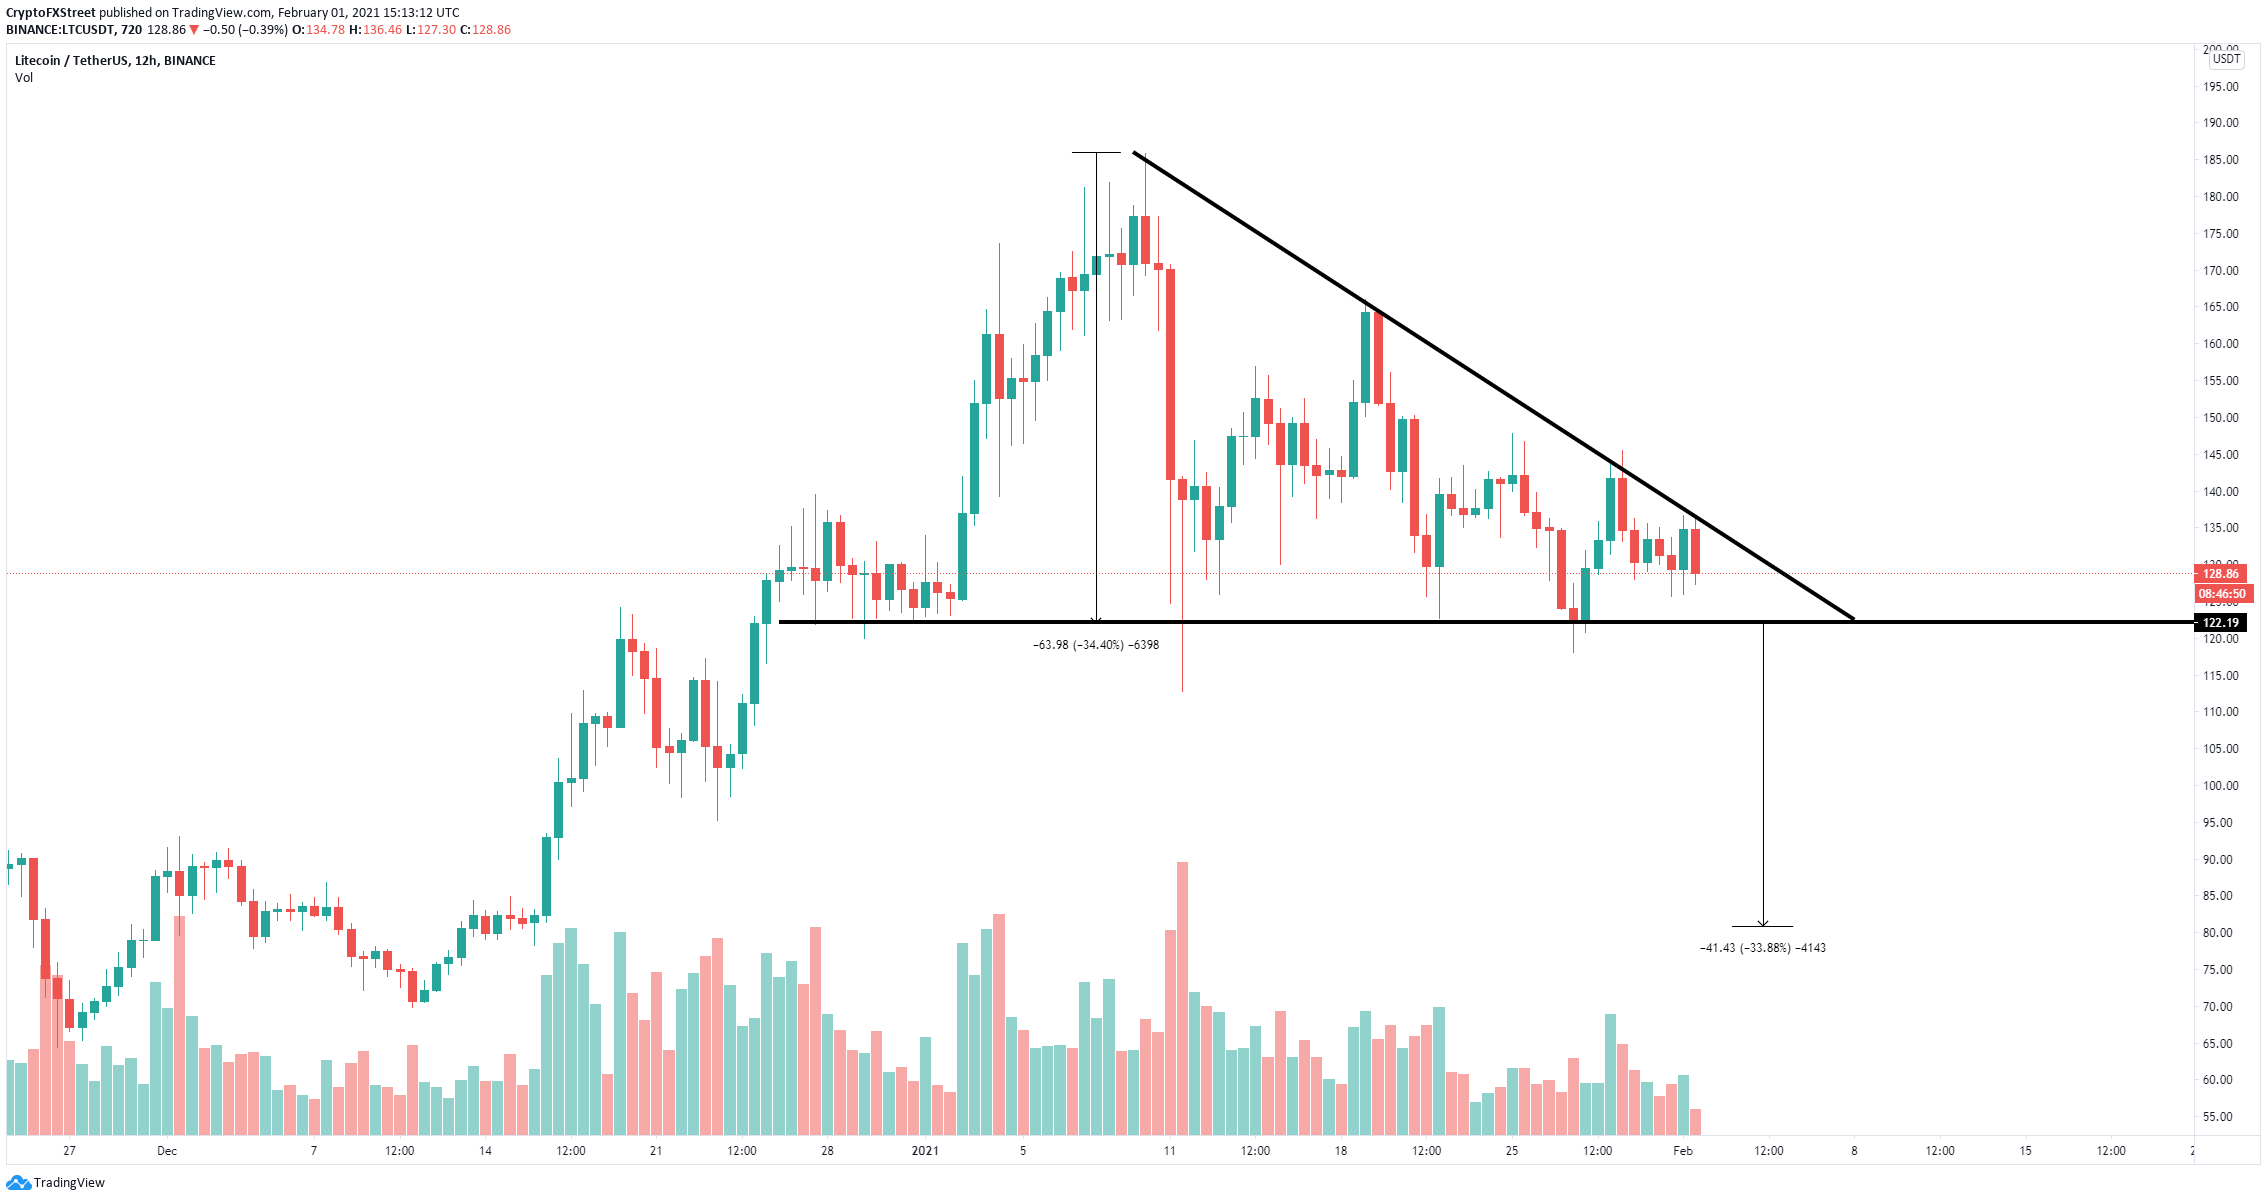
LTC/USD 12-hour chart
A breakdown below $112 would be a significant bearish indicator with a price target of $80, a 34% move calculated using the height of the pattern as a reference point.
Author

Lorenzo Stroe
Independent Analyst
Lorenzo is an experienced Technical Analyst and Content Writer who has been working in the cryptocurrency industry since 2012. He also has a passion for trading.


