![]() Sheldon McIntyre, CMT
Sheldon McIntyre, CMT
Independent Analyst
- Litecoin price closed last week with a 9.81% gain and finished July up 0.05%.
- LTC has defined a double bottom pattern, but it may be plotting a handle after failing to close above $149.26.
- The 50-week simple moving average (SMA) at $143.15 and the 2019 high of $146.00 combine to form fierce resistance.
Litecoin price responded to the oversold condition on the daily Relative Strength Index (RSI) with a 35.71% rally over the next ten days. It was an impulsive response, but LTC failed to trigger the double bottom with a daily close above the midpoint of the base at $149.26. As a result, the cryptocurrency has been coiling along the 50-day SMA, shaping a handle to go with the double bottom. A resolution of the pattern to the upside reveals a 30% opportunity for investors.
Litecoin price waits for a second opportunity
Litecoin price closed positive ten consecutive days from July 21 to July 30, marking the first ten-day gain since 2017 and creating the confidence that LTC had established a firm correction low on July 20.
Since the burst higher, Litecoin price has been consolidating along the 50-day SMA at $134.89, preparing for a second chance to strike a daily close above the double bottom trigger of $149.26. For some, the consolidation could be identified as a handle of the larger double bottom price structure. Either way, LTC is holding steady.
In front of a successful LTC breakout from the double bottom is the resistance framed by the combination of the 50-week SMA at $143.15 with the 2019 high of $146.00.
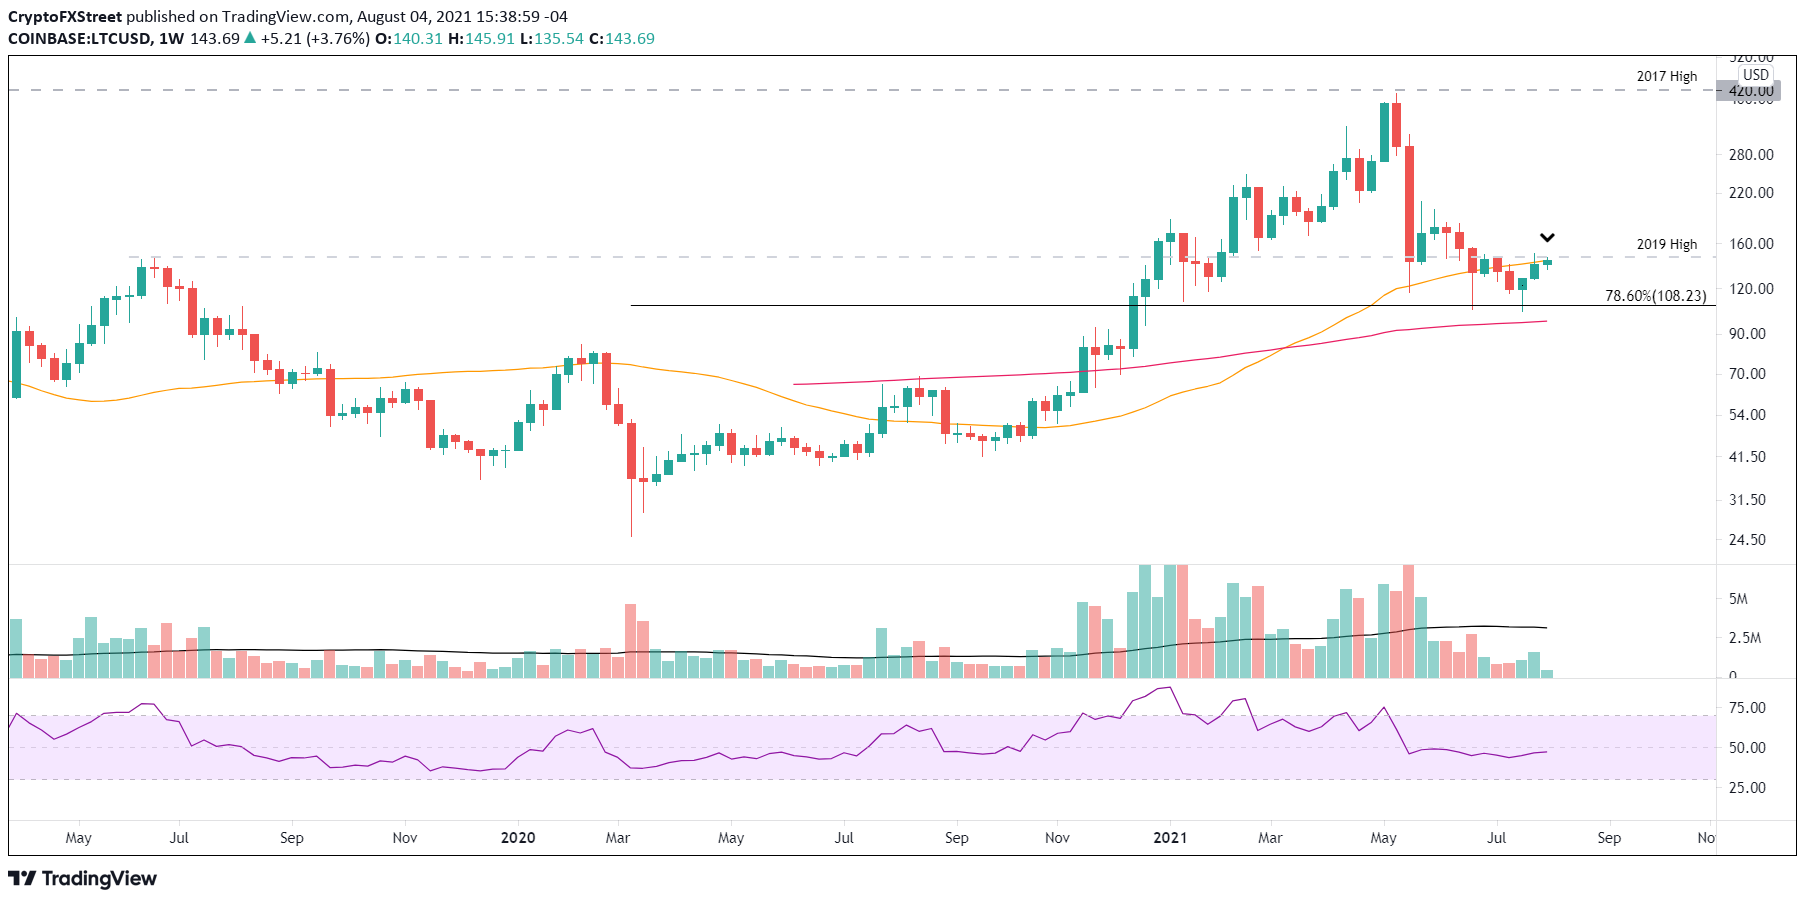
LTC/USD weekly chart
To resume the rally and forge a trend to the 200-day SMA at $191.09, Litecoin price needs to register a daily close above $149.26. It would confirm the double bottom pattern, but it would also free LTC from the intimidating resistance announced by the convergence of the 50-week SMA with the 2019 high. It is the barrier that stands in front of tremendous upside potential for the altcoin.
If Litecoin price successfully overcomes the resistance and activates the pattern, it should see a quick rally to the 200-day SMA at $191.09, delivering a 28% return to timely LTC market operators. An additional upside target is the 38.2% Fibonacci retracement of the May-July at $222.40.
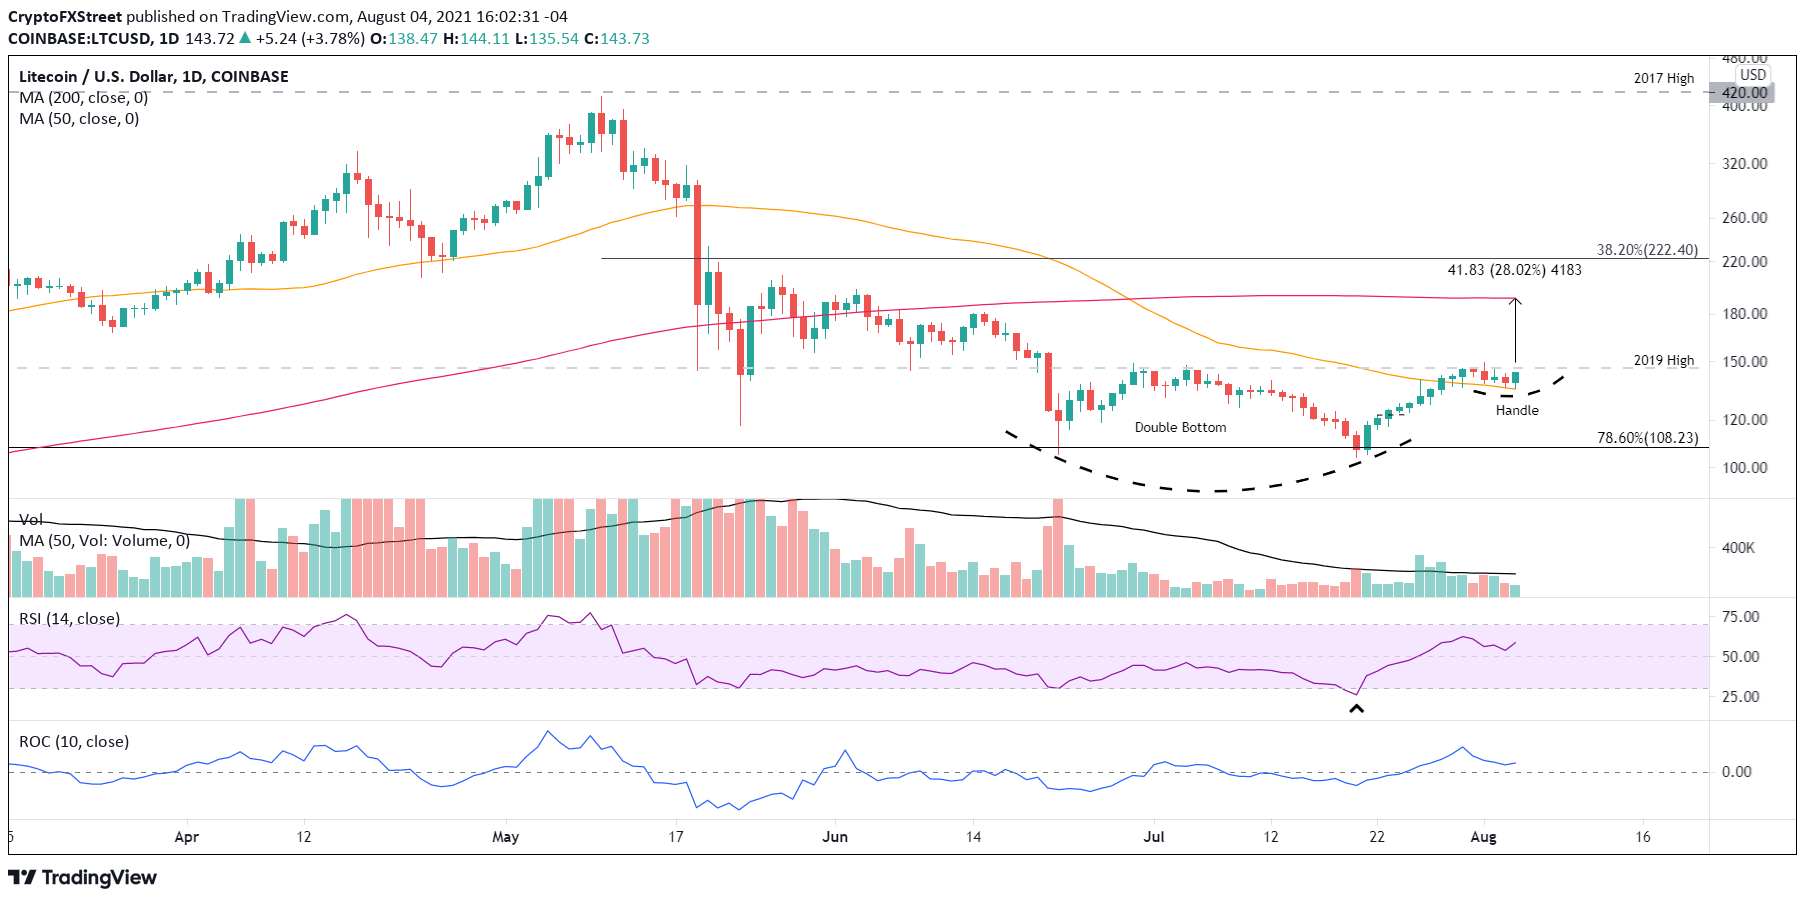
LTC/USD daily chart
On the downside, if Litecoin price cannot limit the consolidation to the 50-day SMA, it should not fall below $127.43. A close below the level will increase the probability that LTC will test the 78.6% retracement level of the 2020-2021 advance at $108.23. A bearish cryptocurrency market could take the altcoin down to the July low of $104.02, confirming the rally as an oversold bounce.
Litecoin price is positioned for a bullish outcome, but until the double bottom triggers, it is a strategy of patience and keeping an eye on the prize.
Note: All information on this page is subject to change. The use of this website constitutes acceptance of our user agreement. Please read our privacy policy and legal disclaimer. Opinions expressed at FXstreet.com are those of the individual authors and do not necessarily represent the opinion of FXstreet.com or its management. Risk Disclosure: Trading foreign exchange on margin carries a high level of risk, and may not be suitable for all investors. The high degree of leverage can work against you as well as for you. Before deciding to invest in foreign exchange you should carefully consider your investment objectives, level of experience, and risk appetite. The possibility exists that you could sustain a loss of some or all of your initial investment and therefore you should not invest money that you cannot afford to lose. You should be aware of all the risks associated with foreign exchange trading, and seek advice from an independent financial advisor if you have any doubts.
Recommended Content
Editors’ Picks

Tether mints another $1,000,000,000 USDT on Justin Sun’s Tron blockchain: TRX traders could profit
Tether, the world’s largest stablecoin issuer, has minted another $1 billion worth of USDT on the Tron blockchain according to Whale Alert data published Friday.

XRP Price Prediction: XRP back above $2 liquidating $18M in short positions, will the rally continue?
Ripple (XRP) seeks support above $2.0020 on Thursday after gaining 14% in the past 24 hours. The token trades at $2.0007 at the time of writing, reflecting growing bullish sentiment across global markets.

Avalanche Octane update goes live on mainnet, slashes transaction fees significantly
Avalanche (AVAX) Octane update, live on mainnet on Thursday, introduces a dynamic fee mechanism to the C-Chain. This mechanism reduces transaction costs during high network activity by adjusting real-time fees, as per ACP-176.

Dogecoin soars as 21Shares files S-1 for DOGE ETF
Dogecoin (DOGE) rallied nearly 12% on Wednesday after asset manager 21Shares filed an S-1 application with the Securities & Exchange Commission (SEC) to launch the 21Shares Dogecoin exchange-traded fund (ETF).

Bitcoin Weekly Forecast: Tariff ‘Liberation Day’ sparks liquidation in crypto market
Bitcoin (BTC) price remains under selling pressure and trades near $84,000 when writing on Friday after a rejection from a key resistance level earlier this week.

The Best brokers to trade EUR/USD
SPONSORED Discover the top brokers for trading EUR/USD in 2025. Our list features brokers with competitive spreads, fast execution, and powerful platforms. Whether you're a beginner or an expert, find the right partner to navigate the dynamic Forex market.