• Litecoin price is bearish amid waning halving-related hype and negative sentiment in the wider market.
  • LTC could shed 15% to $73.40 if the bulls fail to defend the $84.17 support level.
  • The bearish thesis will be invalidated upon a decisive daily candlestick close above $102.68. 

Litecoin (LTC) price indicates a bearish dominance, an outcome majorly attributed to weak buying pressure from investors and a general bearish sentiment across the wider cryptocurrency market. The Litecoin ecosystem has witnessed significant developments since the year started. As of press time, there are less than 100 days to the third halving that would reduce the block rewards. This could typically boost the LTC price.

Also Read: Litecoin community proposes experimental standard less than 100 days away from halving, what to expect

Further, BIT Mining Limited also revealed a new mining infrastructure dedicated to Litecoin. This, coupled with the halving, could serve LTC miners very well. Nevertheless, the Litecoin price has been plunging, with miners selling many coins.

Litecoin price suffers growing negative pressure

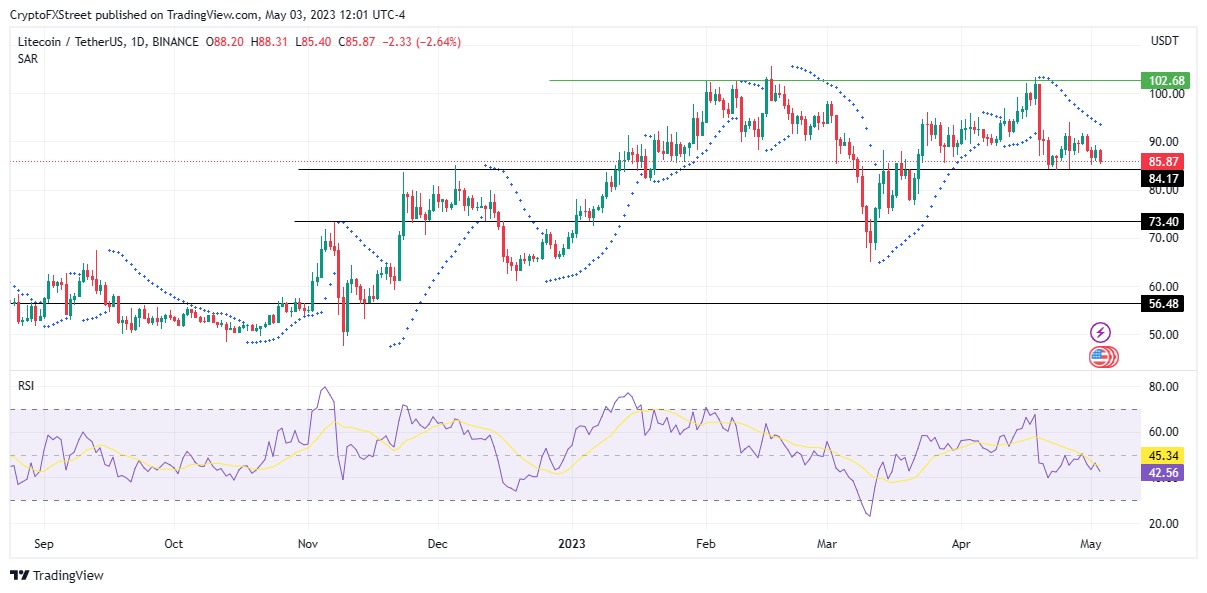
Litecoin price is on a southbound move, but the support at $84.17 appears to be standing strong, having stood for two consecutive weeks. Breakout efforts by the bulls proved premature, requiring more momentum to sustain. As a result, the bears have taken over and the odds are in their favor based on the general outlook.

If seller momentum continues, the price could break below the critical support at $84.17. Below this level, the cliff could see LTC lose 15% to tag the $73.40 support level.

The Relative Strength Index (RSI) position at 43 below the mean line supports the bearish outlook. The southbound move of this trend-following indicator hinted at a continued downtrend. Further, the Parabolic SAR indicator was still negative after flipping bearish and moving above the price since April 19. This also favors the downside.

Notably, the Parabolic SAR is the dotted lines on the one-day chart below for the LTC/USDT trading pair. Whenever it appears below the current price of the asset, it is interpreted as a bullish signal. Conversely, if it is positioned above the asset’s current price, it is deemed to be a bearish signal.

LTC/USDT 1-Day Chart

Conversely, if sidelined investors choose to buy LTC at current low market value, Litecoin price could reverse. In such a case, the northbound move could see the decentralized peer-to-peer (P2P) token flip above the Parabolic SAR and target the area above the psychological $100.00.

In such a case, Litecoin price could tag the $102.68 resistance level, denoting a 20% upswing. 


Information on these pages contains forward-looking statements that involve risks and uncertainties. Markets and instruments profiled on this page are for informational purposes only and should not in any way come across as a recommendation to buy or sell in these assets. You should do your own thorough research before making any investment decisions. FXStreet does not in any way guarantee that this information is free from mistakes, errors, or material misstatements. It also does not guarantee that this information is of a timely nature. Investing in Open Markets involves a great deal of risk, including the loss of all or a portion of your investment, as well as emotional distress. All risks, losses and costs associated with investing, including total loss of principal, are your responsibility. The views and opinions expressed in this article are those of the authors and do not necessarily reflect the official policy or position of FXStreet nor its advertisers. The author will not be held responsible for information that is found at the end of links posted on this page.

If not otherwise explicitly mentioned in the body of the article, at the time of writing, the author has no position in any stock mentioned in this article and no business relationship with any company mentioned. The author has not received compensation for writing this article, other than from FXStreet.

FXStreet and the author do not provide personalized recommendations. The author makes no representations as to the accuracy, completeness, or suitability of this information. FXStreet and the author will not be liable for any errors, omissions or any losses, injuries or damages arising from this information and its display or use. Errors and omissions excepted.

The author and FXStreet are not registered investment advisors and nothing in this article is intended to be investment advice.

Join Telegram

Recommended content


Recommended Content

Editors’ Picks

Celebrity meme coins controversy continues amid Pump.fun revenue dominance

Celebrity meme coins controversy continues amid Pump.fun revenue dominance

Pump.fun outperformed the Ethereum blockchain on Tuesday after raking in $1.99 million. Following this achievement, a meme coin based on actress Sydney Sweeney was the subject of controversy after its developers dumped their bags on investors.

More Meme Coins News

PEPE's on-chain metrics indicate potential rally after weeks of silence

PEPE's on-chain metrics indicate potential rally after weeks of silence

PEPE has struggled to see any significant price move after reaching an all-time high in May. Increased adoption rate and low MVRV ratio indicate a bullish run may be on the horizon. A single PEPE outflow from Binance worth $14.7 million gives credence to signs of bullish expectation.

More Pepe News

Ethereum has failed to overcome key resistance despite bullish sentiment surrounding ETH ETF

Ethereum has failed to overcome key resistance despite bullish sentiment surrounding ETH ETF

Ethereum (ETH) is down more than 1.4% on Tuesday following another ETH sale from the Ethereum Foundation. Meanwhile, crypto exchange Gemini's recent report reveals that ETH ETF could see about $5 billion in net inflows within six months of launch.

More Ethereum News

Crypto community blasts Polkadot following report of treasury spending

Crypto community blasts Polkadot following report of treasury spending

Polkadot reports $87 million of treasury spending during H1. Crypto community members expressed harsh feelings toward the DOT team's high spending. DOT is up more than 2% in the past 24 hours but risks correction following the report.

More Polkadot News

Bitcoin: BTC price correction could end in July, according to seasonal data

Bitcoin: BTC price correction could end in July, according to seasonal data

Bitcoin (BTC) price appears poised for a decline this week, influenced by slight outflows in US spot ETFs, selling activity among BTC miners, and a combined transfer of 4,690.28 BTC to centralized exchanges by the US and German governments.

Read full analysis

BTC

ETH

XRP