- LTC price shows bullish momentum on the Relative Strength Index.
- The volume profile indicator shows bears are not actively shorting.
- Invalidation of the bullish thesis is a breach below $50.81.
Litecoin price could rise in the coming days. Key levels have been identified.
Litecoin price might rally
Litecoin price could take the cryptocurrency market by surprise as a bullish retaliation may unfold in the coming days. Litecoin, the digital silver akin to Bitcoin’s comparison to Gold, has been trading range bound throughout September near the mid $50 level. On October 4, the bulls managed to breach the previous weekly high while dually rallying impulsively.
Litecoin price currently auctions at $54.55. The bulls are testing support from the 8- and 21-day simple moving averages after tagging the previous weekly high at $55. The breach of the weekly high could be viewed as a “calm before the storm signal” If the indicator fails, a rise to the $60 and $66 price levels could occur.
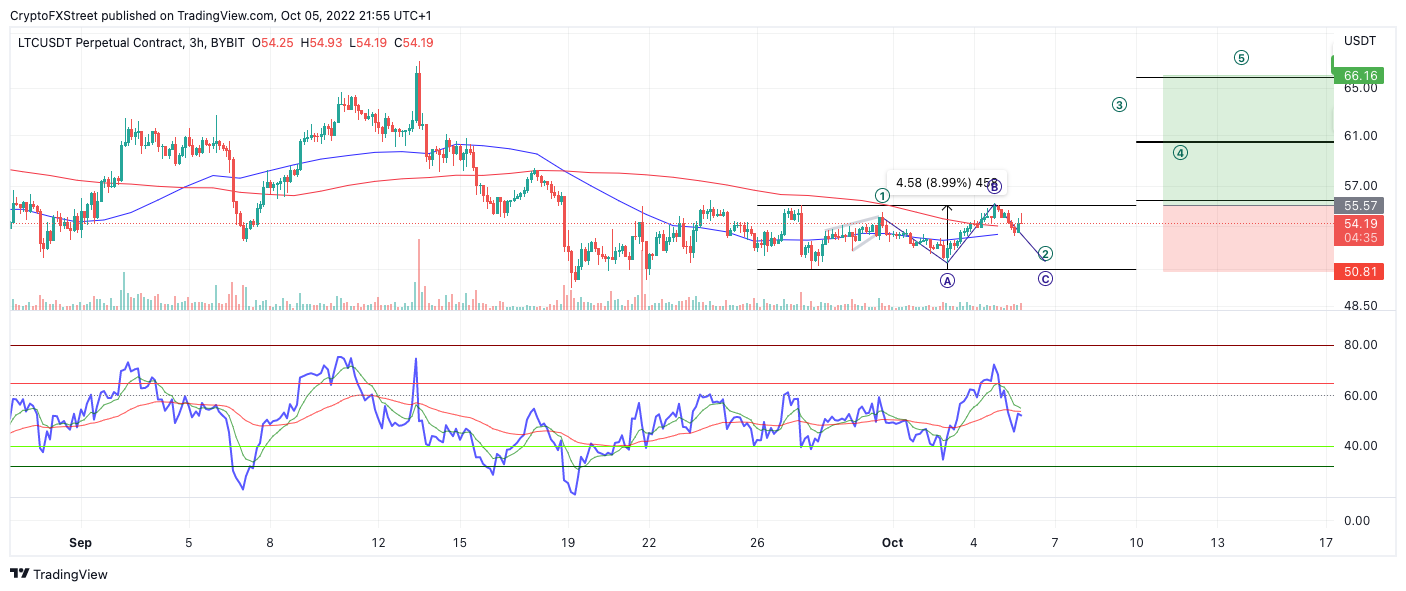
LTC/USDT 3-Hour Chart
The Relative Strength Index is leaning more towards the bullish narrative on smaller time frames. The volume profile indicator remains relatively sparse, showing sellers may be uninterested in lowering the LTC price at the current time.
Traders should keep their eyes on the Litecoin price in the coming days. Ultimately a breach of the weekly low at $50.81 will invalidate the bullish bias. If the invalidation occurs, a further decline towards a 2020 support zone at $45 could result in a 16% decline.
In the following video, our analysts deep dive into the price action of Litecoin, analyzing key levels of interest in the market. -FXStreet Team
Information on these pages contains forward-looking statements that involve risks and uncertainties. Markets and instruments profiled on this page are for informational purposes only and should not in any way come across as a recommendation to buy or sell in these assets. You should do your own thorough research before making any investment decisions. FXStreet does not in any way guarantee that this information is free from mistakes, errors, or material misstatements. It also does not guarantee that this information is of a timely nature. Investing in Open Markets involves a great deal of risk, including the loss of all or a portion of your investment, as well as emotional distress. All risks, losses and costs associated with investing, including total loss of principal, are your responsibility. The views and opinions expressed in this article are those of the authors and do not necessarily reflect the official policy or position of FXStreet nor its advertisers. The author will not be held responsible for information that is found at the end of links posted on this page.
If not otherwise explicitly mentioned in the body of the article, at the time of writing, the author has no position in any stock mentioned in this article and no business relationship with any company mentioned. The author has not received compensation for writing this article, other than from FXStreet.
FXStreet and the author do not provide personalized recommendations. The author makes no representations as to the accuracy, completeness, or suitability of this information. FXStreet and the author will not be liable for any errors, omissions or any losses, injuries or damages arising from this information and its display or use. Errors and omissions excepted.
The author and FXStreet are not registered investment advisors and nothing in this article is intended to be investment advice.
Recommended Content
Editors’ Picks
Sui technical outlook hints at a possible double-bottom formation
Sui (SUI) price action hints at a double-bottom technical formation, which tends to be followed by a bullish move. The Coinglass long-to-short ratio for SUI stands above one and rises, indicating more traders are betting for a rally in SUI.
Bitcoin consolidation continues as market prepares for the next major move
Bitcoin (BTC) has been consolidating between $94,000 and $100,000 since February 5. Glassnode reports weakening capital inflows and declining derivatives activity, with short-term holder accumulation resembling challenging market conditions.
Stellar Price Forecast: XLM’s Total Value Locked reaches over $62 million
Stellar (XLM) price trades inside a channel pattern; a breakout indicates bullish momentum. Crypto intelligence tracker DefiLlama data shows that XLM’s TVL reaches $62 million while the technical outlook projects a target of $0.74.
XRP record gains as SEC acknowledges CoinShares, Canary and WisdomTree's XRP ETF filings
SEC accelerates the XRP ETF filing process by acknowledging CoinShares, Canary and WisdomTree's applications. The new SEC administration has yet to pause the agency's litigation against Ripple due to prioritization of cases with imminent court deadlines.
Bitcoin: BTC consolidates before a big move
Bitcoin price has been consolidating between $94,000 and $100,000 for the last ten days. US Bitcoin spot ETF data recorded a total net outflow of $650.80 million until Thursday.
The Best brokers to trade EUR/USD
SPONSORED Discover the top brokers for trading EUR/USD in 2025. Our list features brokers with competitive spreads, fast execution, and powerful platforms. Whether you're a beginner or an expert, find the right partner to navigate the dynamic Forex market.