Litecoin price could double as LTC fundamentals scream “buy”
- Litecoin price could blast off as multiple fundamental, technical, and on-chain indicators suggest that it is wildly undervalued.
- Grayscale accumulated over 174,000 LTC in the last 30 days, while the price hasn’t moved much.
- Whales holding 100,000 to 1,000,000 LTC have grown by 5.45%, showing interest in this cryptocurrency at the current price levels.

Litecoin price dropped nearly 40% during the market-wide crash on February 20. Now, new developments around LTC suggest that it could lift off soon.
Grayscale makes the most out of LTC dips
Grayscale has been active in each downswing Litecoin price has taken over the past month. The digital assets management firm has acquired 174,939 LTC, representing a 10% increase in its holdings within such a short period.
Despite the substantial increase in buying pressure, Litecoin price has only moved 30%.
Usually, assets surge considerably in price after Grayscale begins to accumulate. For example, Stellar price saw a 107% increase after the company added 29 million XLM to its portfolio.
Contradicting the “Grayscale effect,” Litecoin price has dropped by 28.33% since February 20, while the investment firm bought about 40,000 LTC. This divergence is the first of many indicators, suggesting that LTC’s market value is primed to breakout.
At the time of writing, the Grayscale Litecoin Trust (GLTC) is trading at a whopping 1,787% premium to the spot price of Litecoin, which puts GLTC at $3,284 per unit. The gap between the GLTC price and LTC’s spot price is an accurate representation of its demand.
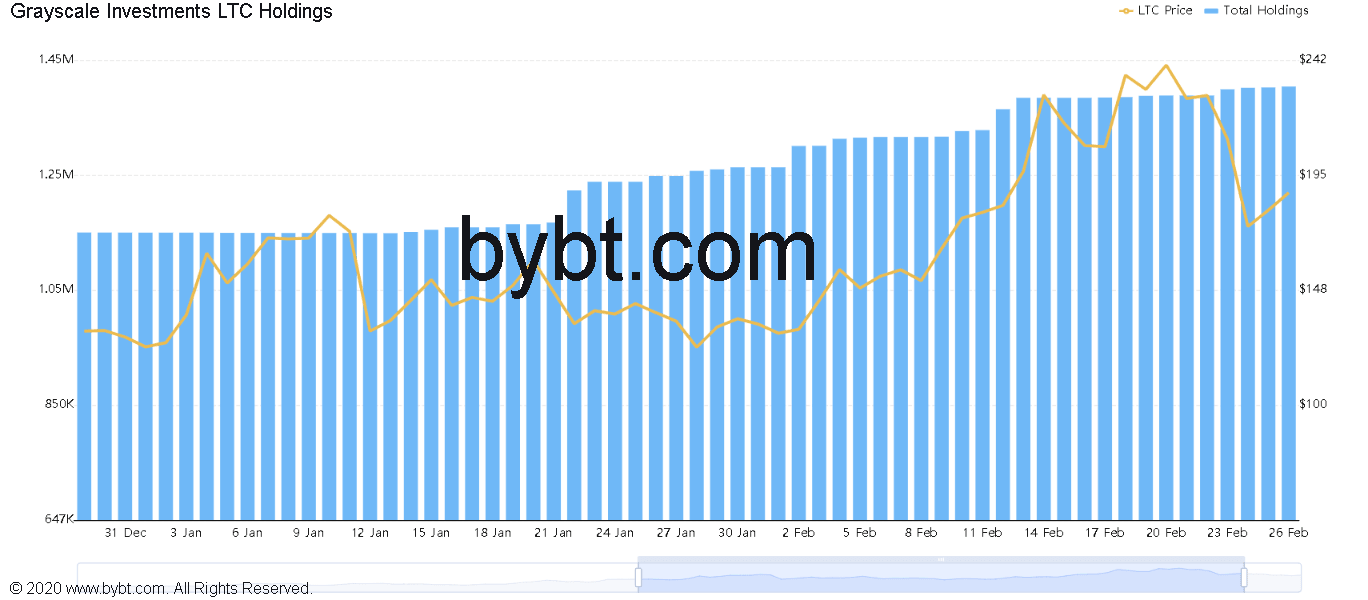
Grayscale’s Litecoin holdings chart
Litecoin price is about to go parabolic
Litecoin price managed to bounce off from the 50-day moving average (MA) after taking a significant nosedive. Now, the Tom DeMark (TD) Sequential indicator presented a buy signal in the form of a green nine candlestick on the 1-day chart, suggesting that LTC is poised for higher highs.
This technical formation forecasts a one to four daily candlestick upswing. Slicing through the 78.6% Fibonacci retracement level at $190 could propel Litecoin price to $230 or even $350.

LTC/USD 1-day chart
The Market Value by Realized Value (MVRV) model adds credence to the bullish outlook. This on-chain metric is currently hovering at -9.79%, which can be considered as the “buy zone.” The last time LTC’s 30-day MVRV was around this level, Litecoin price skyrocketed by 72%.
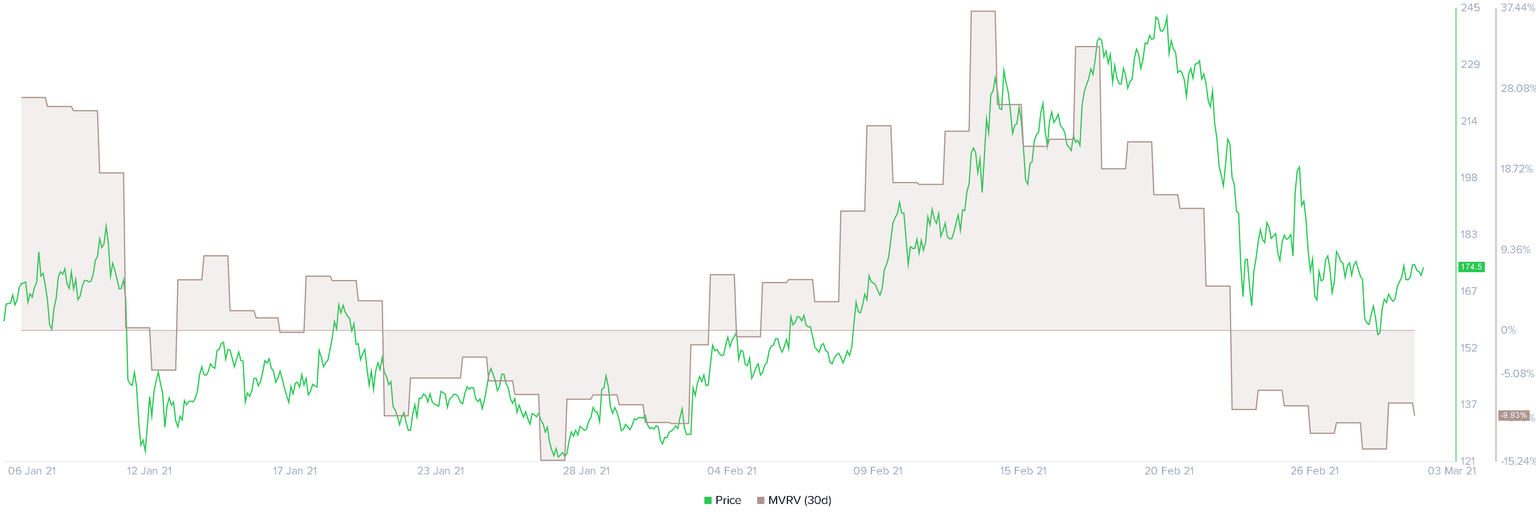
Litecoin MVRV 30-day chart
Moreover, the number of addresses holding between 100,000 to 1,000,000 LTC has increased by 5.45% since February 8. Roughly six new whales have joined the network within this short period.
Such massive accumulation by large investors shows that they are interested in Litecoin at the current price levels.

Litecoin holder distribution chart
Regardless of the bullish outlook, investors should note that a daily candlestick close below the $158 level could be catastrophic. The downswing May have the strength to kickstart a correction that extends up to the 50% Fibonacci retracement level at $136.
Author

Akash Girimath
FXStreet
Akash Girimath is a Mechanical Engineer interested in the chaos of the financial markets. Trying to make sense of this convoluted yet fascinating space, he switched his engineering job to become a crypto reporter and analyst.


