|

Litecoin price analysis: LTC/USD plunges 11% on Thursday 11

  • LTC/USD is down 10% on Thursday the amid growing bear pressure.
  • The break above 30.00 is required to confirm the reversal in the trend.

Litecoin, a recent leader has become the biggest double-digit loser on the market. LTC/USD is down 10% on Thursday the amid growing bear pressure. Following the rejection from $100, Litecoin traded lower highs and lower lows until it found short-term support at $85.00.

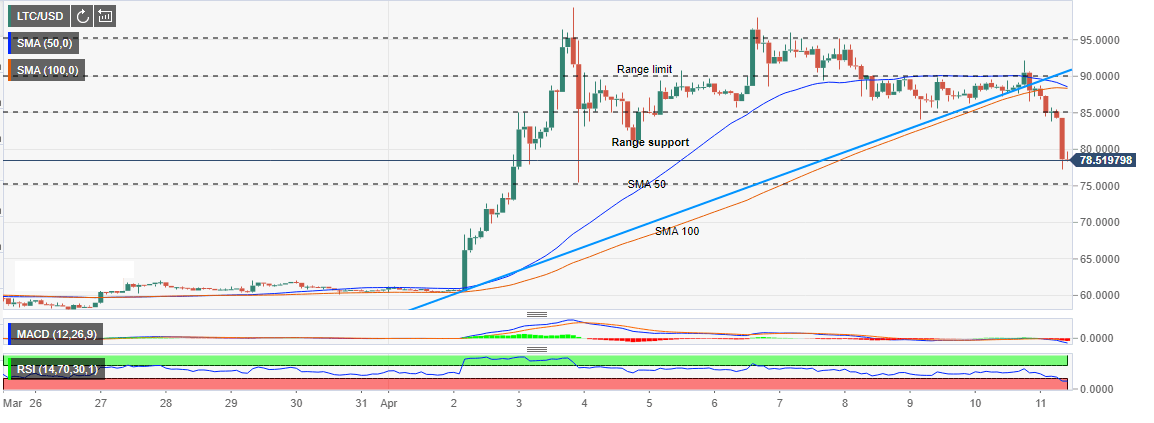
The buyers, however, pushed for gains above the trendline yesterday where Litecoin tested at $90.00. The bullish momentum lost steam allowing the bears to take over. The trend reversed below both the 50 SMA 2-hour and 100 SMA 2-hour. The drop continued below $85.00 and the next support target at $80.00.

At the moment, Litecoin bulls appear to have found bearing at $77.00 paving the way for a weak bearish momentum. LTC/USD currently changes hands at $79.28. It could break above $80.00 and reverse the trend according to various technical indicators. The Relative Strength Index (RSI) is revamping the trend upwards from the lows at 23.52. A break above 30.00 is required to confirm the reversal in the trend. Otherwise, the MACD is still slopping downwards to show that the bear pressure is still present.

LTC/USD 1-hour chart

Author

John Isige

John Isige

FXStreet

John Isige is a seasoned cryptocurrency journalist and markets analyst committed to delivering high-quality, actionable insights tailored to traders, investors, and crypto enthusiasts. He enjoys deep dives into emerging Web3 tren

More from John Isige
Share:

Editor's Picks

Ripple bulls defend key support amid waning retail demand and ETF inflows

XRP ticks up above $1.40 support, but waning retail demand suggests caution. XRP attracts $4 million in spot ETF inflows on Thursday, signaling renewed institutional investor interest.

Crypto Today: Bitcoin, Ethereum, XRP rebound as risk appetite improves

Bitcoin rises marginally, nearing the immediate resistance of $68,000 at the time of writing on Friday. Major altcoins, including Ethereum and Ripple, hold key support levels as bulls aim to maintain marginal intraday gains.

Bitcoin Weekly Forecast: No recovery in sight 

Bitcoin price continues to trade sideways between $65,729 and $71,746, extending its consolidation since February 7. US-spot ETFs record an outflow of $403.90 million through Thursday, pointing to the fifth consecutive week of withdrawals.

Pi Network Price Forecast: PI recovery stalls amid profit-taking

Pi Network tests 50-day EMA support on Friday, after a 5% decline the previous day. PiScan data shows large deposits on CEXs totaling over 4 million PI tokens in the last 24 hours, reflecting an exodus of investors taking profits.

Bitcoin Price Annual Forecast: BTC holds long-term bullish structure heading into 2026

Bitcoin (BTC) is wrapping up 2025 as one of its most eventful years, defined by unprecedented institutional participation, major regulatory developments, and extreme price volatility.

Bitcoin: No recovery in sight

Bitcoin (BTC) price continues to trade within a range-bound zone, hovering around $67,000 at the time of writing on Friday, and falling slightly so far this week, with no signs of recovery.