Litecoin LTC Technical Analysis: LTC/USD big bear rejection, bounce cut short
- Litecoin nursing deep losses of over 6% late on Tuesday.
- LTC/USD encountered big rejection at 61.8% Fibonacci, after seeing a bounce off from the sessions lows.
- Bears will be looking to make a test for $30 to the downside.

LTC/USD 60-minute chart
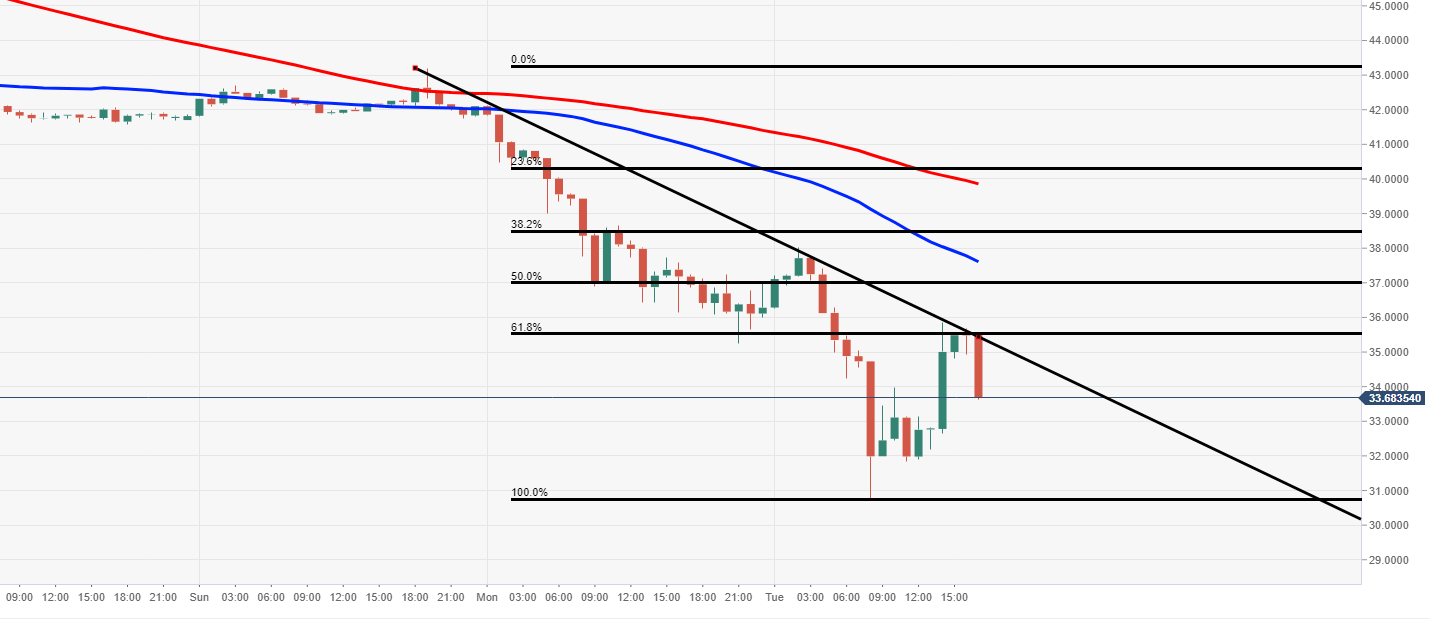
Spot rate: 33.77
Relative change: -6.90%
High: 42.11
Low: 35.23
Trend: Bearish
Support 1: 33.64, daily pivot point support.
Support 2: 31.00, daily pivot point support. .
Support 3: 26.76, daily pivot point support.
Resistance 1: 35.57, 61.8% Fibonacci.
Resistance 2: 37.62, 50MA (60-minute).
Resistance 3: 39.91, 100MA & 23.6% Fibonacci.
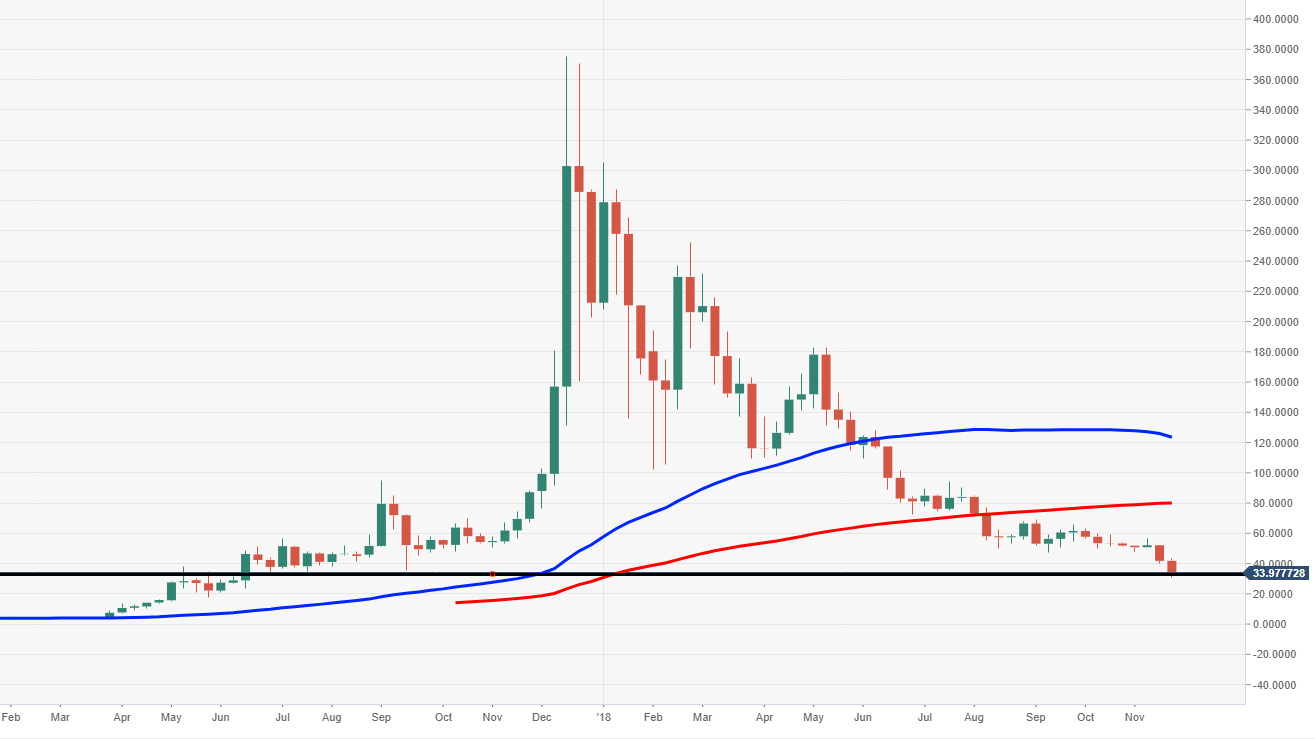
LTC/USD weekly chart
- Weekly chart shows price remains around lowest levels since June 2017, a further extended move south could be very punshing.
Author

Ken Chigbo
Independent Analyst
Ken has over 8 years exposure to the financial markets. He started his career as an analyst, covering a variety of asset classes; forex, fixed income, commodities and equities.


