- Lido Dao price action is playing a dangerous game after a failed breakout higher.
- LDO is at risk of being sucked into a bull trap.
- Seeing the timing of this trap ahead of a heavy month of February, the current mood could dampen and turn into another sell-off.
Lido Dao (LDO) price has had a strong bullish print this week as price action moved above the 78.6% Fibonacci level at $0.786. Meanwhile, price action has been fading and is even starting to trade quite far off the break at the red descending trend line. This so close to the weekly close and with several central banks lined up to come out with their first monetary assessment of the situation for 2023 creates the risk of a bull trap that could have far-reaching consequences.
Lido Dao price could be in for an underestimated risk in February
Lido Dao is still young in its assistance since the price action saw the light of day back in May of 2022. After having experienced the crypto winter as a novice to the other cryptocurrencies, LDO has substantially gained back control of the upper echelon in its price level with an almost full swing back up toward its opening price. LDO broke above it briefly this week and then retreated below it as bulls seem doubtful about whether to stay in or take a profit.
The timing of all this, and the current positioning just below the red descending trend line, does not come as a surprise, seeing that the violence in Ukraine is predicted to enter a more acute phase after tank deliveries from Germany and the US were approved and several central banks are set to make their first appearance for 2023. Expect more downside to come as those same central banks have already issued warnings throughout January that markets have advanced too quickly and too high. Expect a drop back to $2 with the risk of the green ascending trend line coming under pressure. A break would see a move toward $1.60 in the possible sell-off that follows by April.
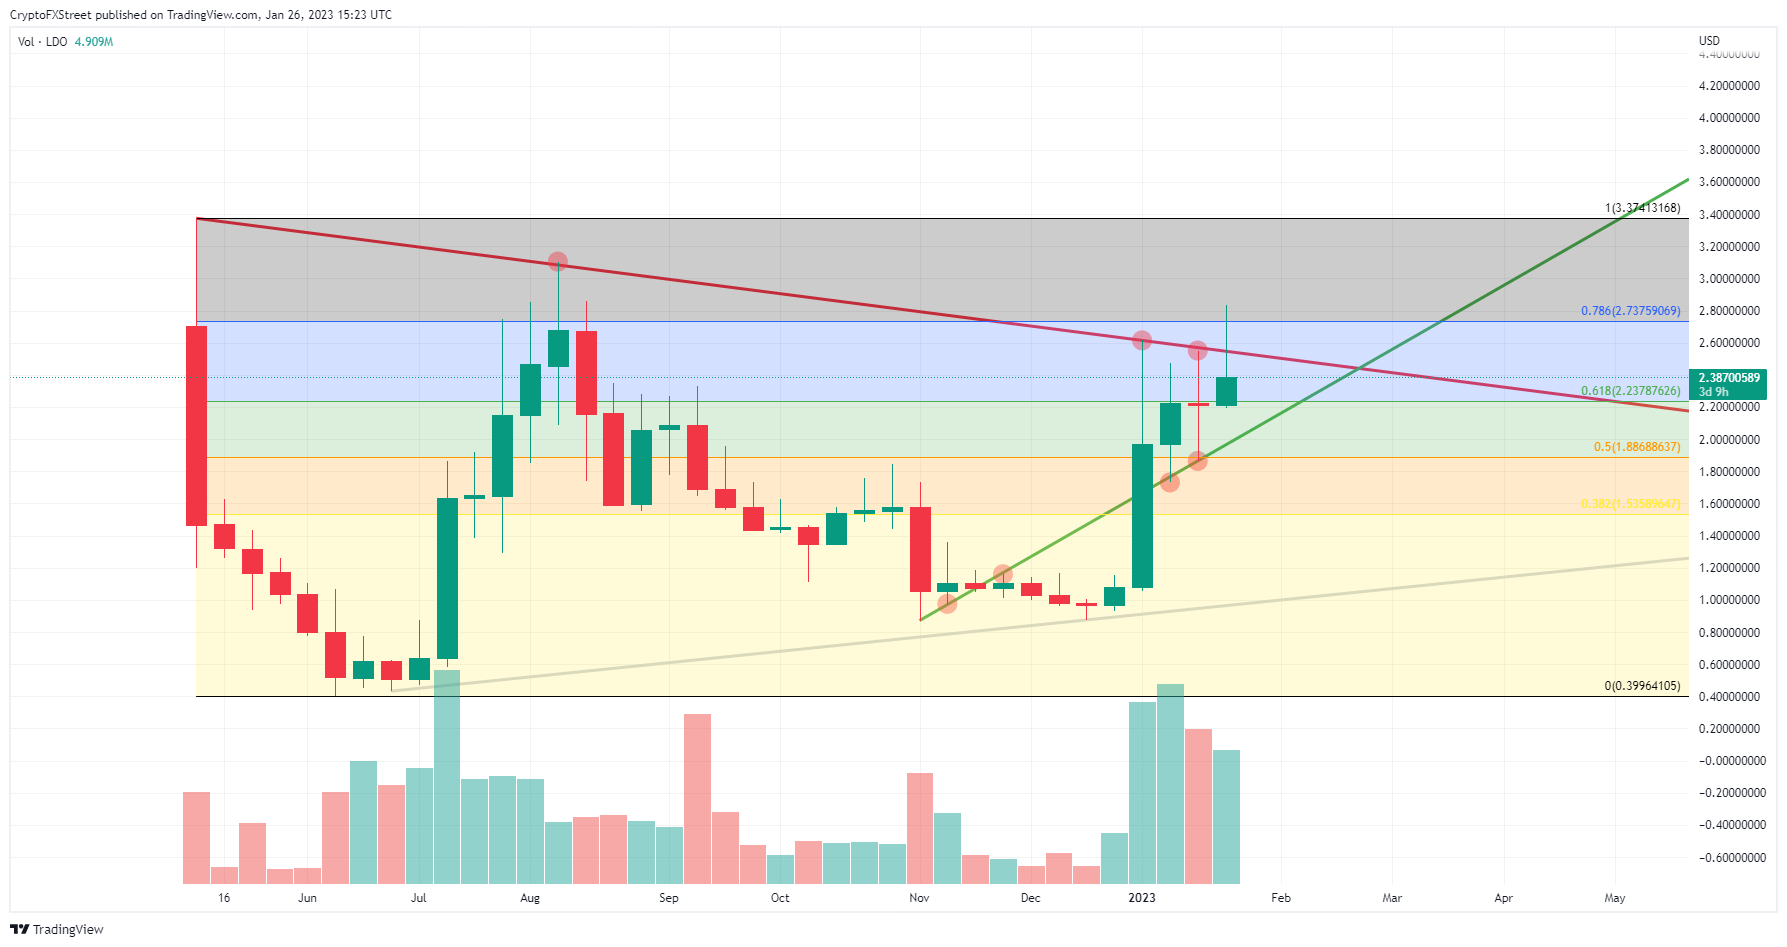
LDO/USD weekly chart
As bulls have already pierced through that red descending trend line, many stops from bears will have been taken out. They will not enter again quickly due to LDO's steep recovery. Expect in the coming weeks to see a surge in LDO price again with an ultimate level at $3.40 by the end of February.
Information on these pages contains forward-looking statements that involve risks and uncertainties. Markets and instruments profiled on this page are for informational purposes only and should not in any way come across as a recommendation to buy or sell in these assets. You should do your own thorough research before making any investment decisions. FXStreet does not in any way guarantee that this information is free from mistakes, errors, or material misstatements. It also does not guarantee that this information is of a timely nature. Investing in Open Markets involves a great deal of risk, including the loss of all or a portion of your investment, as well as emotional distress. All risks, losses and costs associated with investing, including total loss of principal, are your responsibility. The views and opinions expressed in this article are those of the authors and do not necessarily reflect the official policy or position of FXStreet nor its advertisers. The author will not be held responsible for information that is found at the end of links posted on this page.
If not otherwise explicitly mentioned in the body of the article, at the time of writing, the author has no position in any stock mentioned in this article and no business relationship with any company mentioned. The author has not received compensation for writing this article, other than from FXStreet.
FXStreet and the author do not provide personalized recommendations. The author makes no representations as to the accuracy, completeness, or suitability of this information. FXStreet and the author will not be liable for any errors, omissions or any losses, injuries or damages arising from this information and its display or use. Errors and omissions excepted.
The author and FXStreet are not registered investment advisors and nothing in this article is intended to be investment advice.
Recommended Content
Editors’ Picks
Ripple update: XRP shows resilience in recent crypto market sell-off
Ripple's XRP is up 6% on Tuesday following a series of on-chain metrics, which reveals investors in the remittance-based token held onto their assets despite the wider crypto market sell-off last week.
Floki DAO floats liquidity provisioning for a Floki ETP in Europe
Floki DAO — the organization that manages the memecoin Floki — has proposed allocating a portion of its treasury to an asset manager in a bid to launch an exchange-traded product (ETP) in Europe, allowing institutional investors to gain exposure to the memecoin.

Six Bitcoin mutual funds to debut in Israel next week: Report
Six mutual funds tracking the price of bitcoin (BTC) will debut in Israel next week after the Israel Securities Authority (ISA) granted permission for the products, Calcalist reported on Wednesday.

Crypto Today: BTC hits new Trump-era low as Chainlink, HBAR and AAVE lead market recovery
The global cryptocurrency market cap shrank by $500 billion after the Federal Reserve's hawkish statements on December 17. Amid the market crash, Bitcoin price declined 7.2% last week, recording its first weekly timeframe loss since Donald Trump’s re-election.

Bitcoin: 2025 outlook brightens on expectations of US pro-crypto policy
Bitcoin price has surged more than 140% in 2024, reaching the $100K milestone in early December. The rally was driven by the launch of Bitcoin Spot ETFs in January and the reduced supply following the fourth halving event in April.

Best Forex Brokers with Low Spreads
VERIFIED Low spreads are crucial for reducing trading costs. Explore top Forex brokers offering competitive spreads and high leverage. Compare options for EUR/USD, GBP/USD, USD/JPY, and Gold.