LDO price has the potential to rally an additional 40% based on these factors
- LDO price has rallied 12% in the last 24 hours.
- The volume profile indicator shows an influx of buying pressure.
- Invalidation of the bullish thesis is a breach below $1.50.

LDO price shows significant bullish strength. If market conditions persist, an additional 40% rally could occur. Key levels have been defined to gauge LDO's next potential move.
LDO price has upside potential
LDO price could be setting up for a promising rally in the coming weeks. Since November 2, the digital currency has rallied 12%, making LDO one of the only cryptocurrencies to completely diverge from the recent Fed-hike-induced sell-off on the crypto market.
LDO price currently auctions at $1.66 as the bulls have established a large bullish engulfing into a previous support zone on the 8-hour chart. Accompanying the bullish price action is an influx of volume hinting that the uptrend will continue. The Relative Strength Index has space to climb, and the indicator's two moving averages may produce a bullish cross in the coming hours.
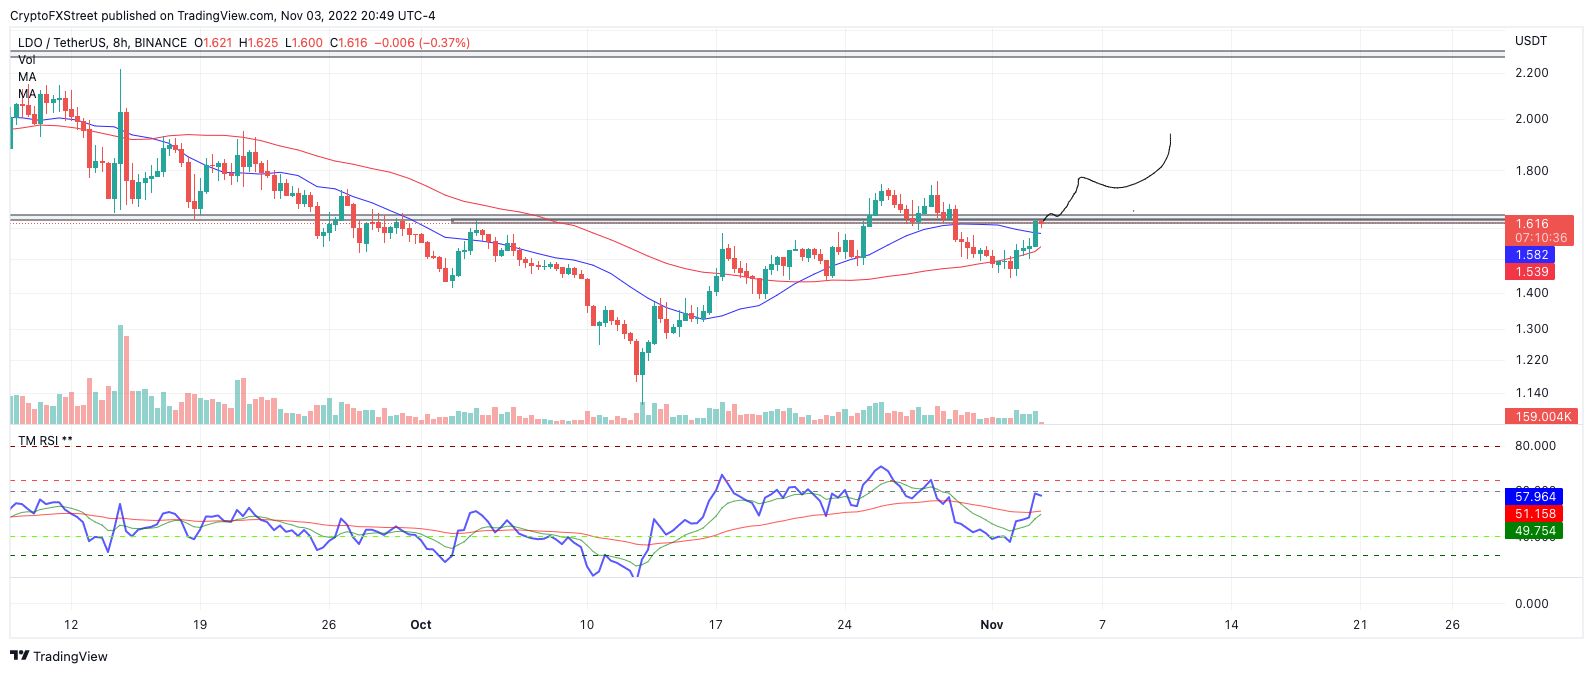
LDOUSDT 8-Hour Chart
Combining these factors, there is still potential for LDO to continue rallying higher. A key level to aim for would be the September swing highs near $2. Such a move would result in a 40% increase from the current LDO price. A break and retest of the support zone between the $1.60-$1.65 could be the signal that sidelined bulls are waiting for to enter the market.
Bullish invalidation depends on the thrust candle at $1.50 remaining unbreached. If the bears tag the low, an additional dip toward the previous congestion zone at $1.35 could occur. Such a move would result in a 15% decline from the current market value.
In the following video, our analysts deep dive into the price action of Bitcoin, analyzing key levels of interest in the market. -FXStreet Team
Author

Tony M.
FXStreet Contributor
Tony Montpeirous began investing in cryptocurrencies in 2017. His trading style incorporates Elliot Wave, Auction Market Theory, Fibonacci and price action as the cornerstone of his technical analysis.


