Key indicators challenge Fed's 'normalization' rate cut that torched Bitcoin rally
-
The post-Fed risk-on rally supports the normalization narrative.
-
Some indicators, like the unemployment rate, the ratio between leading and lagging economic indicators, and the Gold-Oil ratio, disagree, pointing to an impending slowdown.
Since the U.S. Federal Reserve (Fed) cut rates by 50 basis points a week ago, the debate has been raging on whether the so-called easing represents the normalization of an overly tight monetary policy aimed at taming inflation or preparation for an impending economic swoon.
Risk assets, including pure fiat liquidity plays like Bitcoin (BTC) and altcoins, have rallied since the Fed decision, a sign that markets perceive the rate cut as a normalization move. Some analysts foresee accelerated gains once Bitcoin surpasses the $65,200 resistance.
However, at least three indicators point to an economic malaise ahead, suggesting caution on the part of the bulls. Perhaps, the Fed delivered an outsized rate cut, taking note of these forward-looking indicators.
Rising joblessness
The U.S. Household Survey, which tracks the unemployment rate across 50 states, Washington D.C., and Puerto Rico, showed that as of August, more than 57% of states experienced an increase in joblessness compared to the preceding month and the same period last year, according to data tracked by MacroMicro.
The fact that most states are witnessing an uptick in the unemployment rate means the risk of reduced income, consumer spending and investment, and a decline in business and consumer confidence in the months ahead, potentially leading to a marked economic slowdown, if not an outright recession (consecutive quarters of economic contraction). A slowdown could see investors scale back exposure to riskier investments.
"According to August's analysis, 57.7% of U.S. states reported higher unemployment rates than the previous month and year. This points to increasing challenges in the labor market, possibly signaling a more widespread slowdown," MacroMicro said on X.
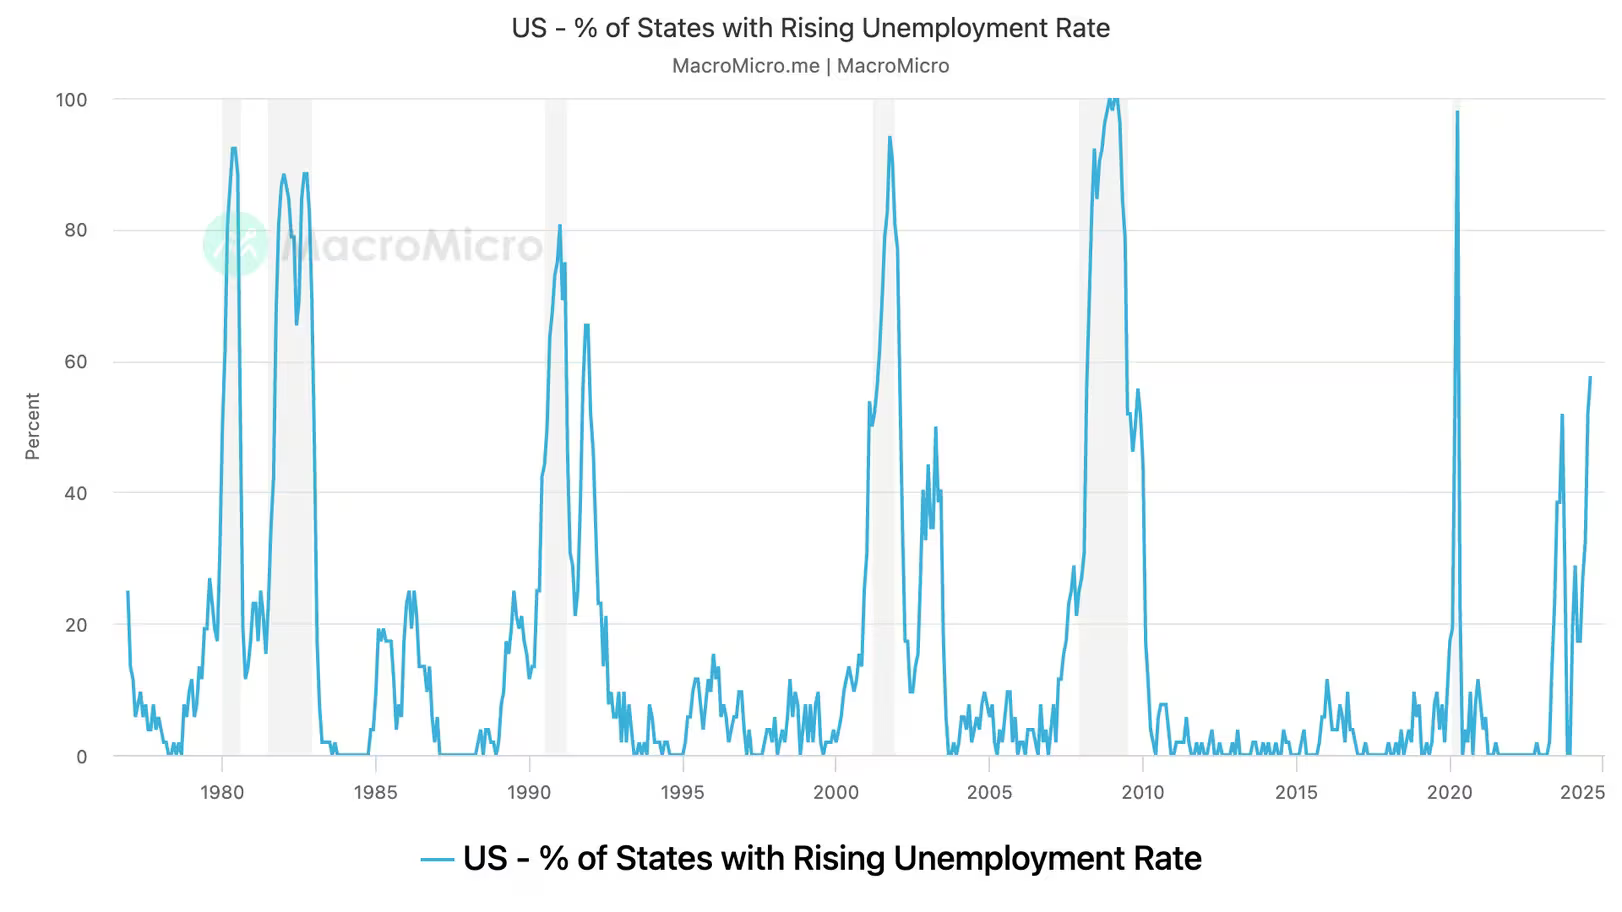
Most states are experiencing an uptick in the joblessness, pointing to a potential economic swoon ahead. (MacroMicro) (MacroMicro)
Lead/lag ratio
Conference Board's Leading Economic Index (LEI) fell to 100.2 in August, falling to its lowest since October 2016. The index marked its sixth consecutive monthly decline, triggering a recession signal.
The LEI comprises several forward-looking indicators such as average weekly hours in manufacturing, average weekly initial claims for jobless insurance, ISM new orders index, stock prices and leading credit index. The index is widely tracked to identify shifts in economic trends and turning points in asset prices.
More concerning is the slide in the ratio between leading and lagging indicators to under 0.85, the lowest since at least the 1950s, according to data tracked by Jeff Weniger, head of equities at WisdomTree.
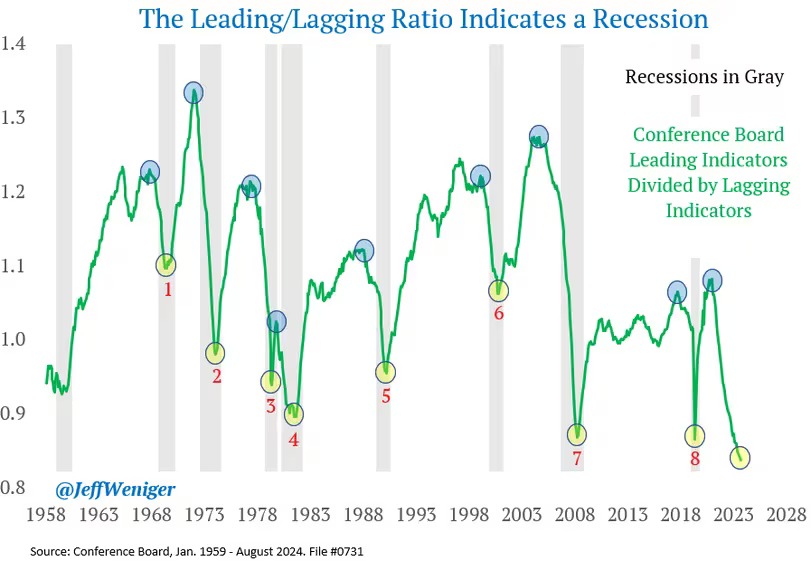
The ratio between Conference Board's leading and lagging economic indicators. (Jeff Weniger) (Jeff Weniger)
The plunge seen over the past several months points to a potential slowdown or recession, with lagging indicators catching up to the economic reality.
The ratio has seen eight similar meltdowns in the past, each portending a recession.
Surging Gold/Brent ratio
The ratio between prices for gold futures and brent crude futures has surged over 35% this year to nearly 40 points, the highest since 2020, according to data source MacroMicro.
Gold is a safe haven asset and an inflation hedge, while oil is tied to global demand and economic activity. Therefore, gold's prolonged outperformance relative to oil is often taken to represent a sign of economic slowdown.
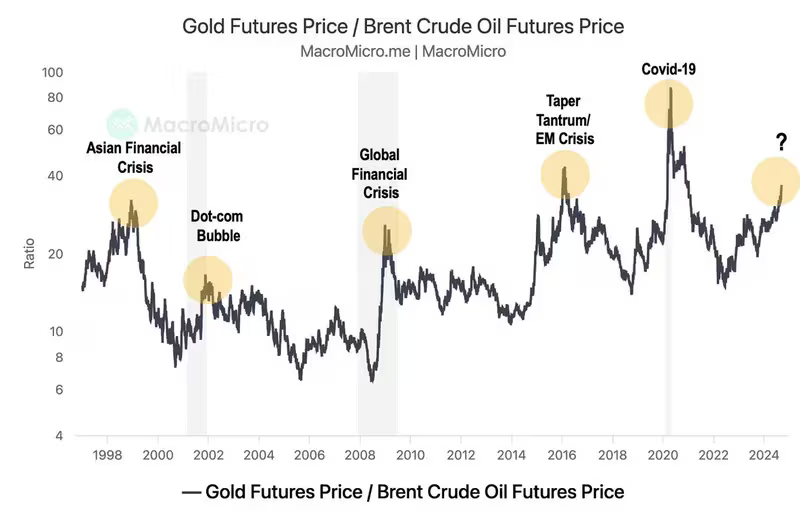
Gold futures to Brent futures ratio. (MacroMicro) (MacroMicro)
Author

CoinDesk Analysis Team
CoinDesk
CoinDesk is the media platform for the next generation of investors exploring how cryptocurrencies and digital assets are contributing to the evolution of the global financial system.


