Jupiter price is poised for a rally after retesting major support area
- Jupiter price is retesting the support area between $0.708 and $0.637, eyeing a reversal ahead.
- On-chain data paints a bullish picture, as JUP’s long-to-short ratio is above one.
- A daily candlestick close below $0.637 would invalidate the bullish thesis.

Jupiter (JUP) rebounded 4.4% after testing a key support area on Wednesday. Despite a slight 1.4% dip on Thursday, a sustained reversal appears likely if the support zone continues to hold. A long-to-short ratio exceeding one further validates the bullish outlook.
Jupiter price is set for an upswing after validated support holds
Jupiter price bounced off 4.4% after retesting the major support area between $0.708 and $0.637 on Wednesday. This support area also coincides with the lower band on the volume profile level (the total volume traded at a given price level during a certain period into up volume) around $0.718, making this a key reversal zone. At the time of writing on Thursday, it trades slightly down by 1.4% at $0.723.
If this support area holds, JUP could rally 30% to restest its daily resistance at $0.921.
The Relative Strength Index (RSI) and the Awesome Oscillator on the daily chart trade below their respective neutral levels of 50 and zero. Both indicators must trade above their neutral levels for the bullish momentum to be sustained. Such a development would add a tailwind to the recovery rally.

JUP/USDT daily chart
Coinglass’s Jupiter’s long-to-short ratio also stands at 2.01, supporting the bullish outlook. This ratio reflects bullish sentiment in the market, as the number above one suggests that more traders anticipate the price of the asset to rise.
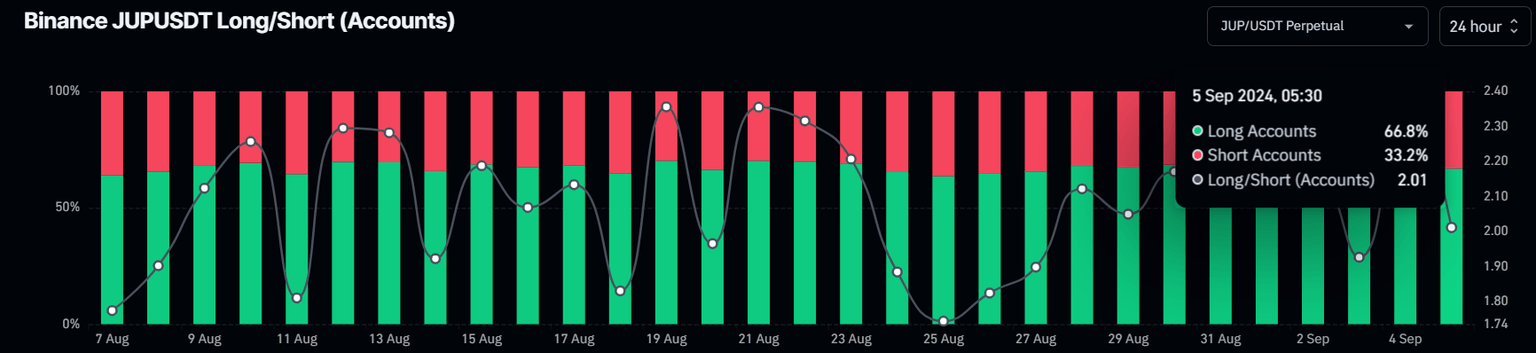
Jupiter long-to-short ratio chart
However, If Jupiter’s daily candlestick closes below the lower band of the support zone at $0.637, the outlook will shift to bearish. This scenario could lead to an 8% decline to retest its March 7 low of $0.585.
Author

Manish Chhetri
FXStreet
Manish Chhetri is a crypto specialist with over four years of experience in the cryptocurrency industry.


