JP Morgan says Bitcoin could retrace as technicals show downswing to $14,000 in sight
- In the absence of substantial activities from retail investors, Bitcoin price drops while institutional investors accumulate.
- A lead strategist at JP Morgan expects a further adverse price action on BTC amidst sell-off from momentum traders.
- Multiple technical indicators appear to confirm the bearish stance.

JP Morgan maintains that Bitcoin price is poised for a steep correction. Until interest from retail investors’ fully kicks in, it appears the pioneer cryptocurrency could remain at the mercy of speculators who contributed immensely to the recent downward price action.
Bitcoin price is currently driven by institutional investors
Nikolaos Panigirtzoglou, Managing Director at JP Morgan, said that commodity trading advisors and other quantitative funds are responsible for Bitcoin’s decline over the past week. As “momentum traders” significantly increased their espouse to BTC in futures markets, pressure was building for a long squeeze.
The analyst added that even though many weak hands were shaken off during the recent correction, a further downtrend in Bitcoin price will likely follow in the absence of substantial demand around the current levels.
“The previous froth in momentum traders’ positioning has been cleared to a large extent. [Now,] momentum traders have room to further propagate [a steeper decline],” said Panigirtzoglou.
The cryptocurrency market currently seems to be one-sided as more institutional investors are accumulating a big number of Bitcoin. Meanwhile, the retail sector has yet to come into the picture.
Panigirtzoglou maintains that only demand from the small fish in a big pond will be able to dilute the impact of the so-called “whales.”
Further losses on the horizon
While market participants remain “extremely greedy” about Bitcoin price action, several technical patterns point to a steeper correction in the near-term.
Indeed, BTC seems to be developing a cup-and-handle on its weekly chart. This technical formation shows that the correction might not be over as the “handle” of the pattern has yet to form.
If Bitcoin bulls fail to break above the $20,000 resistance barrier, a pullback towards $14,000 may occur.
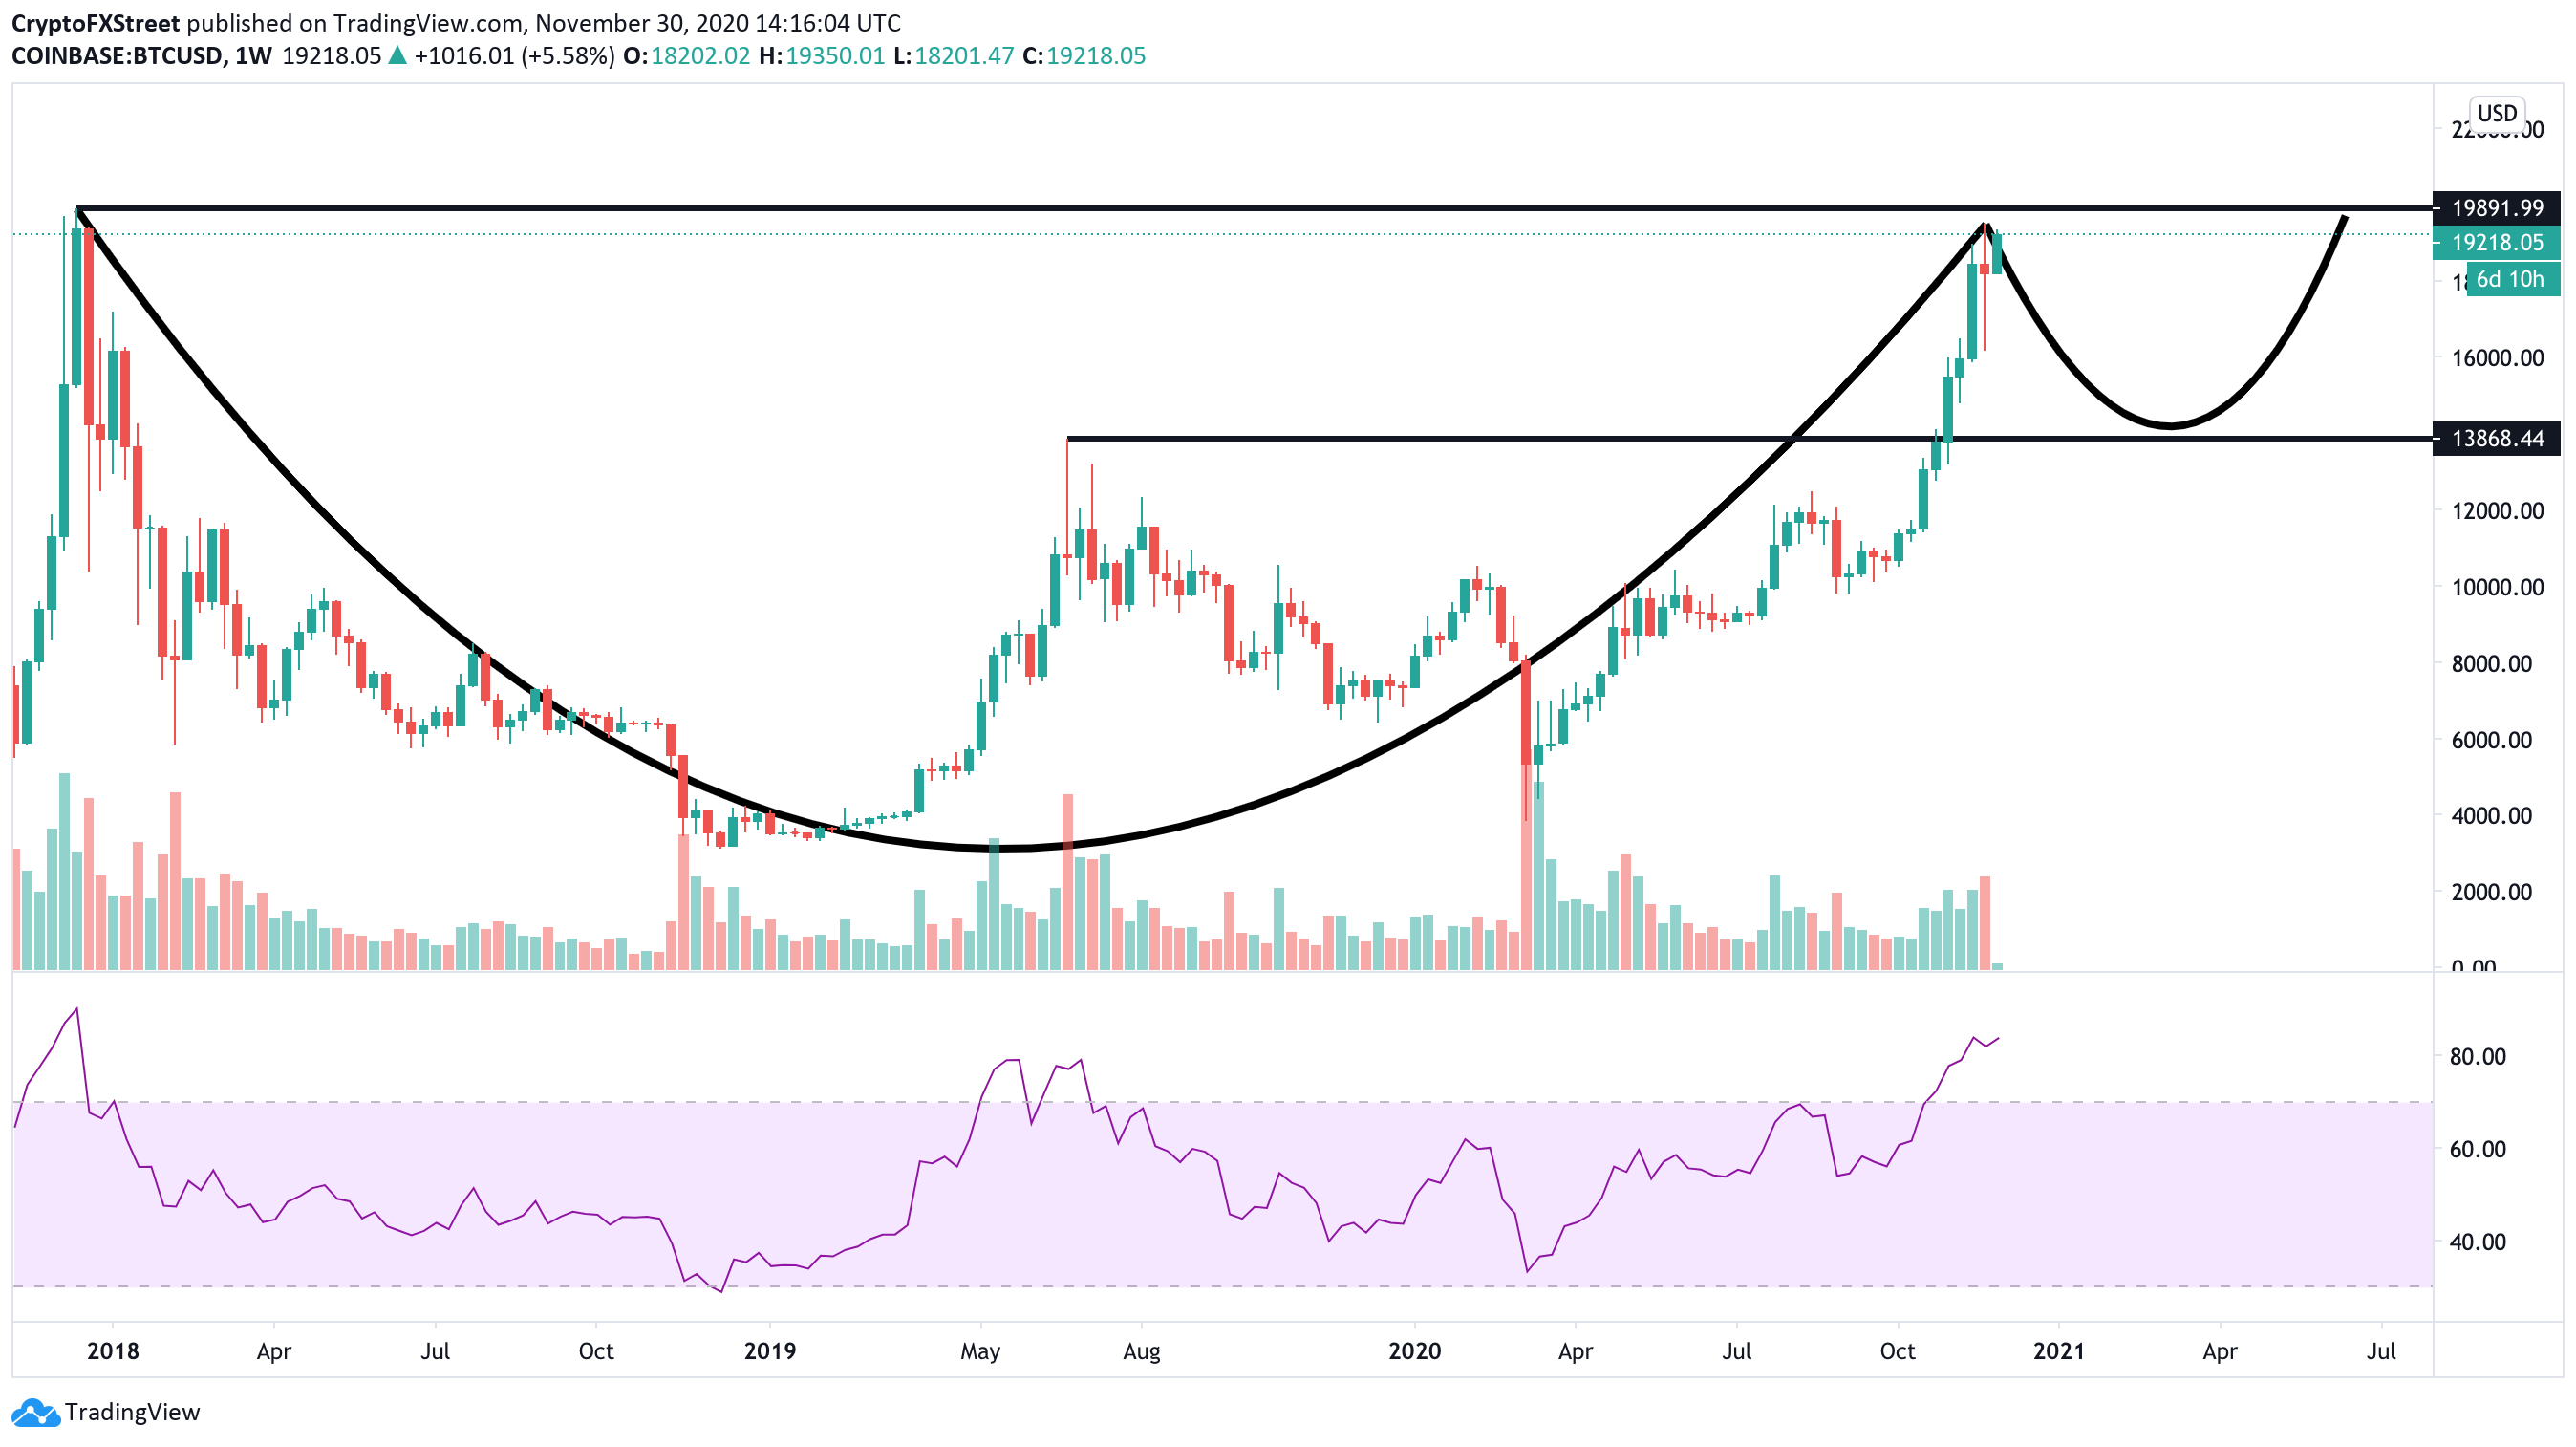
BTC/USD Weekly Chart
The Relative Strength Index (RSI) adds credence to the bearish outlook. This technical indicator suggests that Bitcoin sits in overbought territory as it hovers around 84 for the first time since December 2017.
If all of these sell signals play out, a drop to $14,000 could encourage sidelined investors to get back in the market. A potential spike in buying pressure around this price level might propel the Bitcoin price above the $20,000 mark and see it rise as high as $30,000 before another correction.
Author

FXStreet Team
FXStreet


