Jito price could hit $6 as JTO coils up inside this bullish pattern
- Jito price action shows a potential cup and handle formation.
- Based on theoretical measurement rules, a successful breakout could yield a 56% rally to $6.0.
- A breakdown of the $3.86 support level would create a lower low for JTO and invalidate the bullish thesis.

Jito (JTO) price has been on an uptrend since forming a local bottom in early January. Since then, JTO has revisited the key swing point formed in early December, suggesting the bulls’ intention to move higher.
Jito price coils up for an explosive move
Jito price has produced a rounded bottom between December 9, 2023, and March 16, 2024. But the retracement that began after mid-March, hints that this rounded bottom could transform into a bullish pattern termed – cup and handle.
This technical formation contains a rounded bottom called a ‘cup’ followed by a ‘handle’. The handle is a brief, downward trend to the right of the cup's peak. It typically doesn't fall below the bottom of the cup. A trend line drawn connecting the cup and the handle’s peaks is key for tracking a breakout.
A decisive close above this resistance level forecasts a 56% upswing to $6.0 obtained by measuring the distance between the cup’s peak to the right side and the bottom of the cup and adding it to the breakout point at $3.86.
This move will be interesting to watch, considering it will overcome the $4 and the $5 psychological levels to tag the next one at $6.
Also read: SBF sentenced to 25 years in prison after November conviction
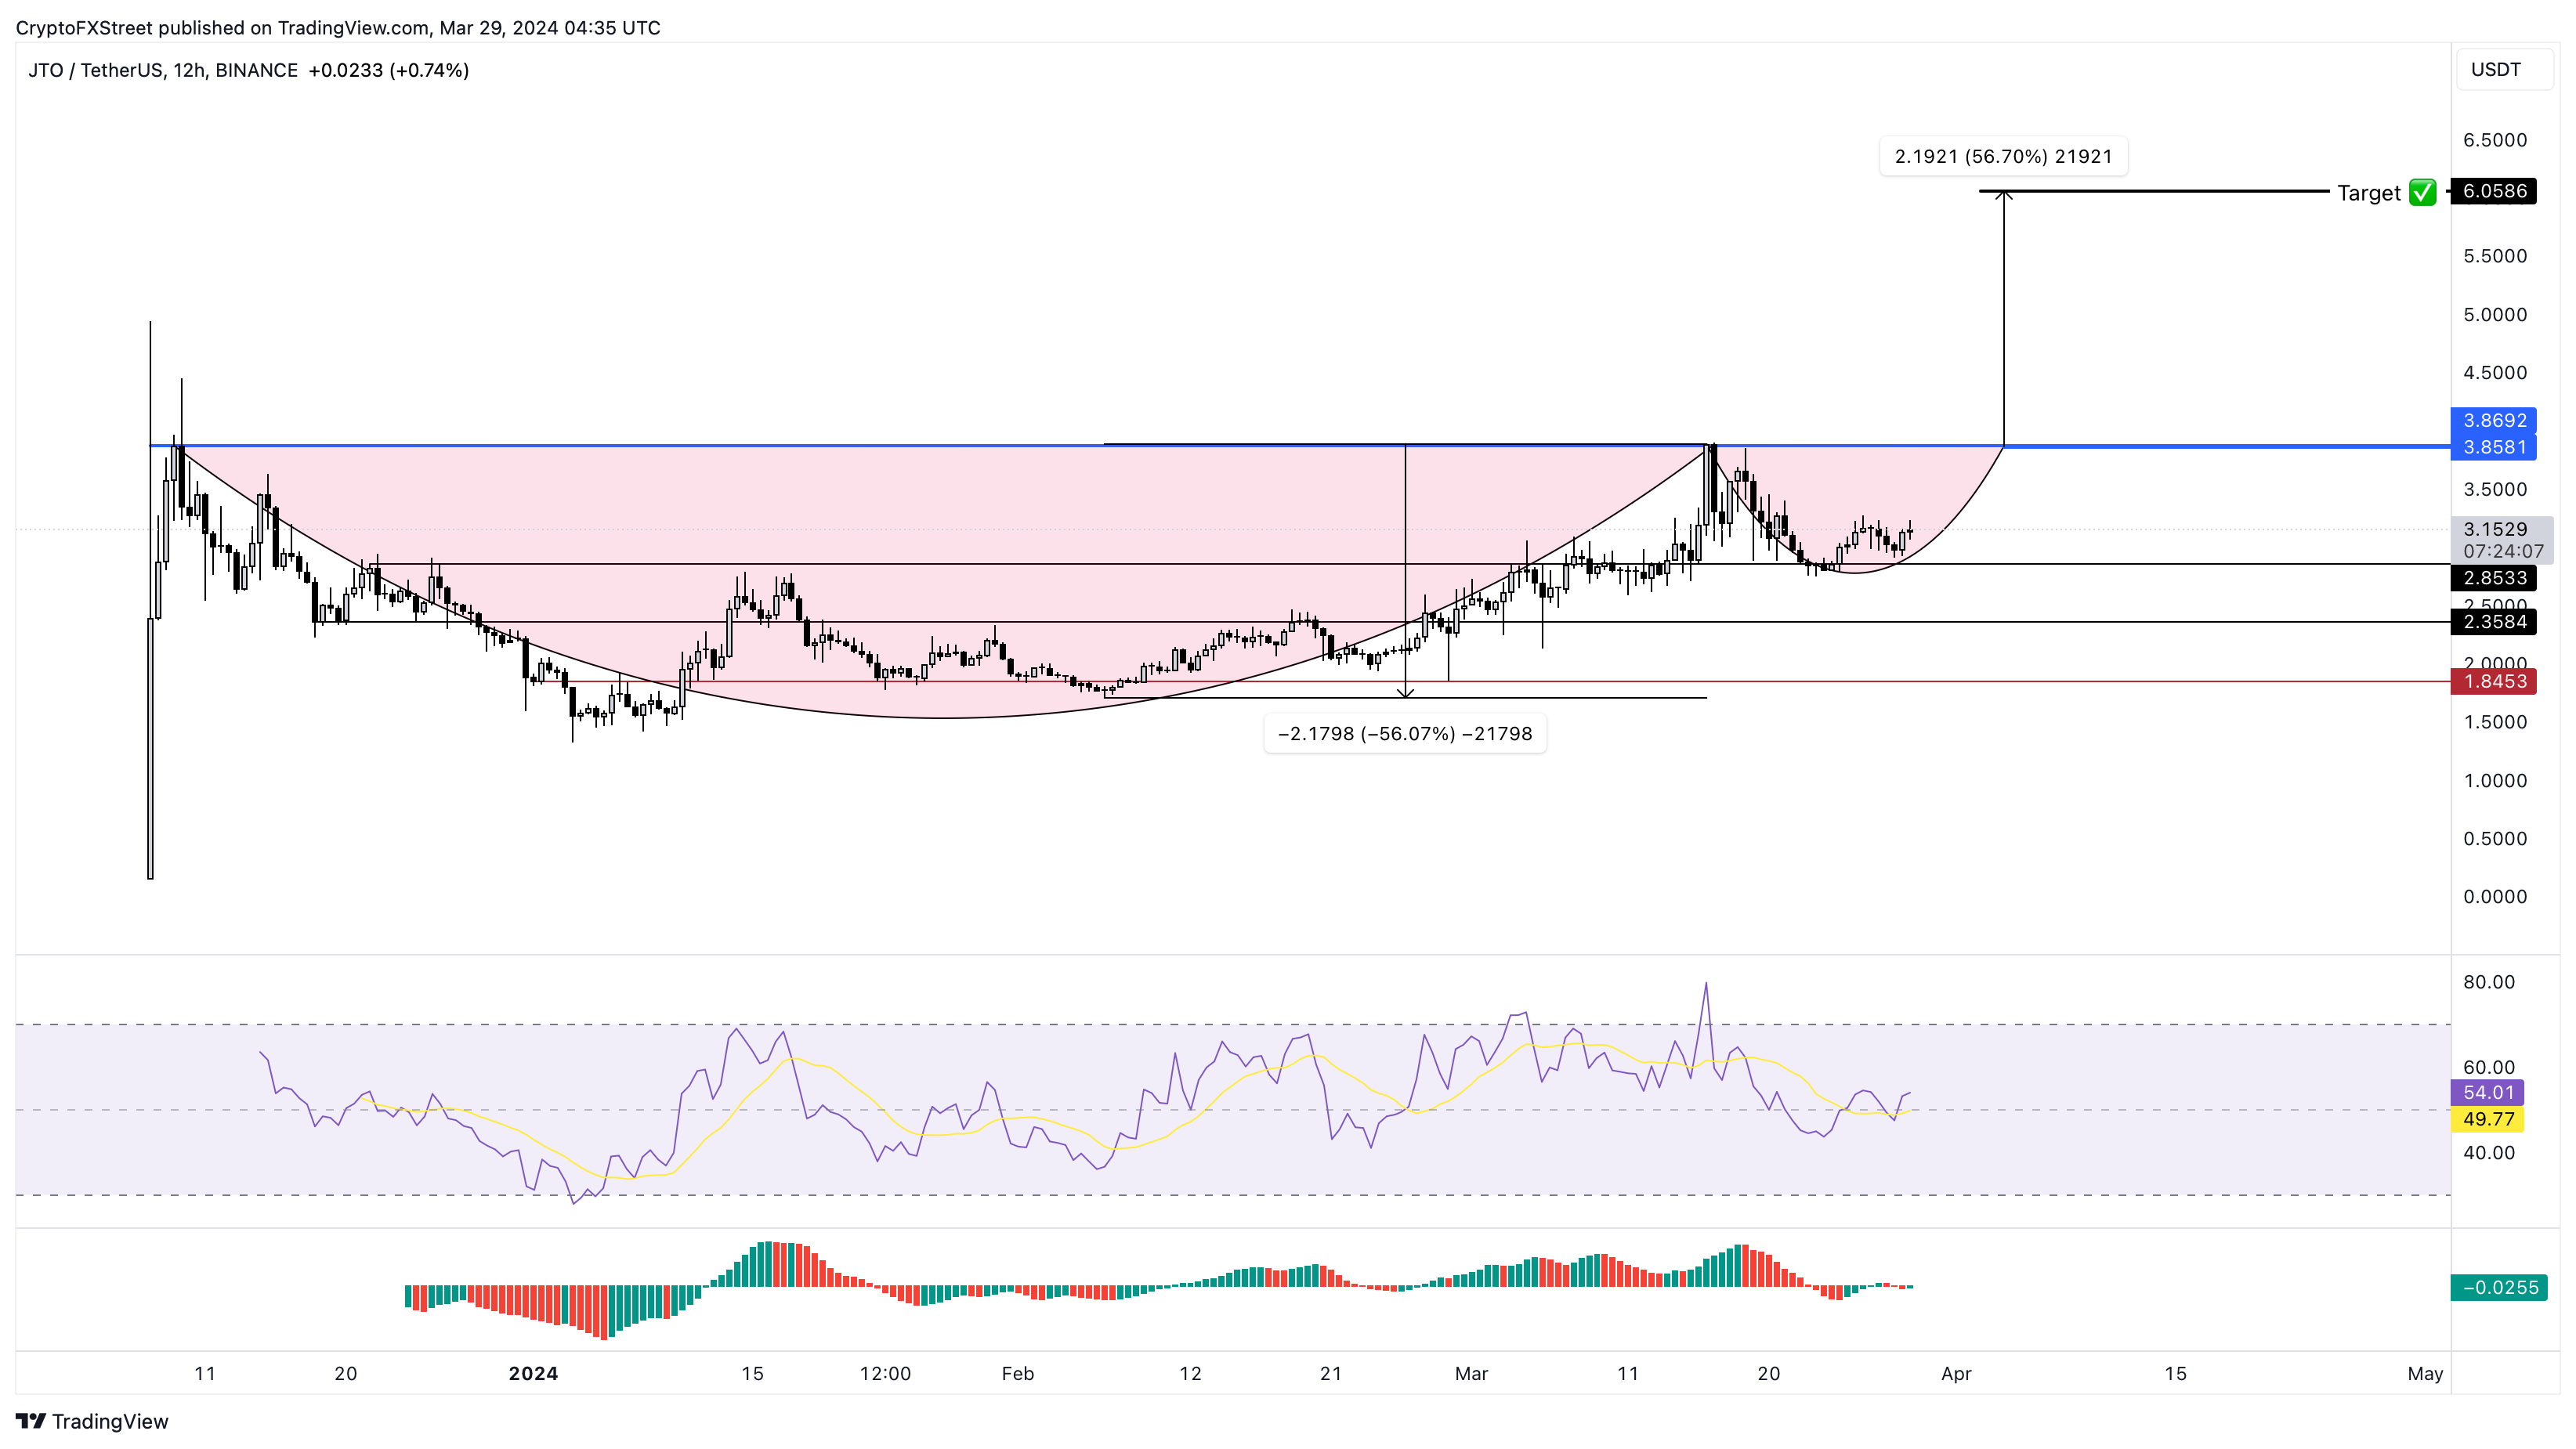
JTO/USDT 12-hour chart
While the outlook for the Jito price looks logical, the confirmation for the cup and handle setup is not here. The cup part of the pattern is yet to form. Beyond that, JTO needs to flip the breakout level at $3.86 to provide confirmation.
If Bitcoin price triggers a correction, Jito price could slide lower. In such a case, if JTO produces a twelve-hour candlestick close below the $2.85 support level, it would create a lower low and invalidate the bullish thesis. This development could lead to a 17% crash to the next key support level at $2.85.
Premium
You have reached your limit of 3 free articles for this month.
Start your subscription and get access to all our original articles.
Author

Akash Girimath
FXStreet
Akash Girimath is a Mechanical Engineer interested in the chaos of the financial markets. Trying to make sense of this convoluted yet fascinating space, he switched his engineering job to become a crypto reporter and analyst.


