Is the ongoing drop the start of a long-term bearish trend?

The new week has started with the ongoing drop of the cryptocurrency market as all coins from the top 10 list are in the red zone.
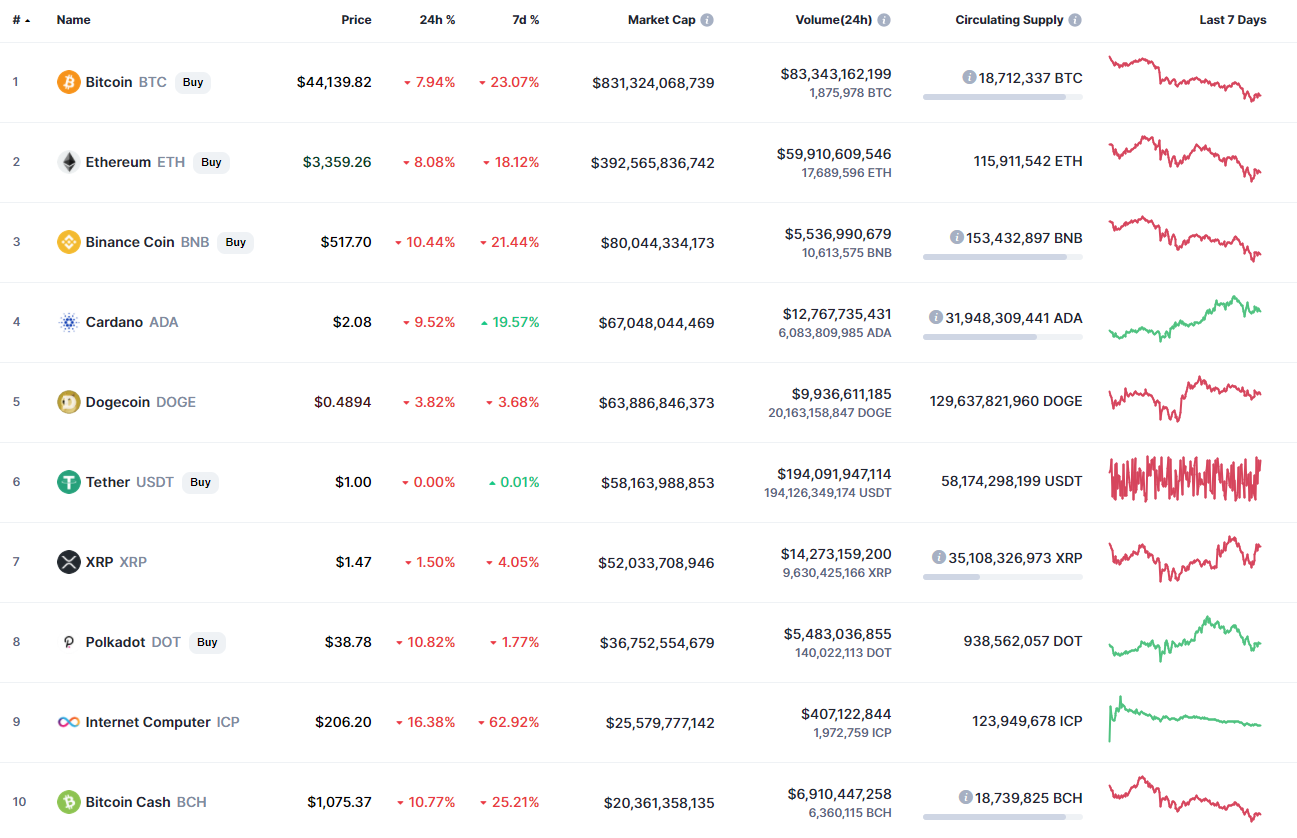
Top coins by CoinMarketCap
BTC/USD
Bitcoin (BTC) keeps falling, and the decline over the last day is by 8%.
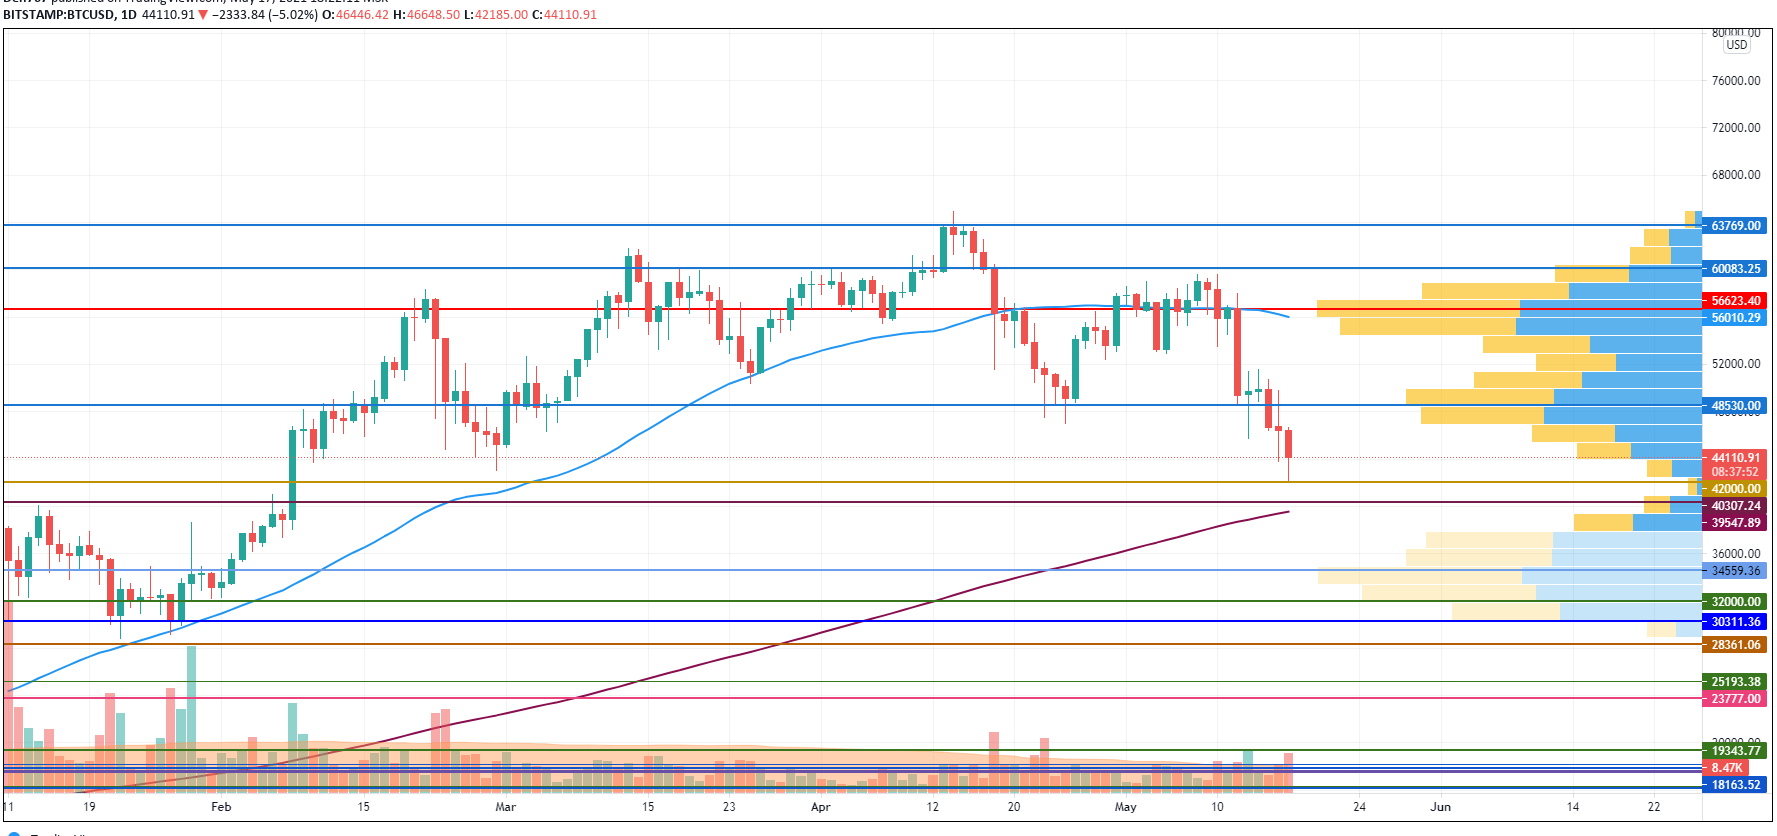
BTC/USD chart by TradingView
On the daily chart, Bitcoin (BTC) has bounced off the support at $42,000 and has almost tested the MA 200. The selling trading volume remains high, which means that the fall might not have ended yet.
However, in the short-term scenario, traders might expect growth to the area around $48,000 where most of the liquidity is focused.
Bitcoin is trading at $44,140 at press time.
ETH/USD
Ethereum (ETH) is more bearish than Bitcoin (BTC) as the drop has constituted almost 9%.
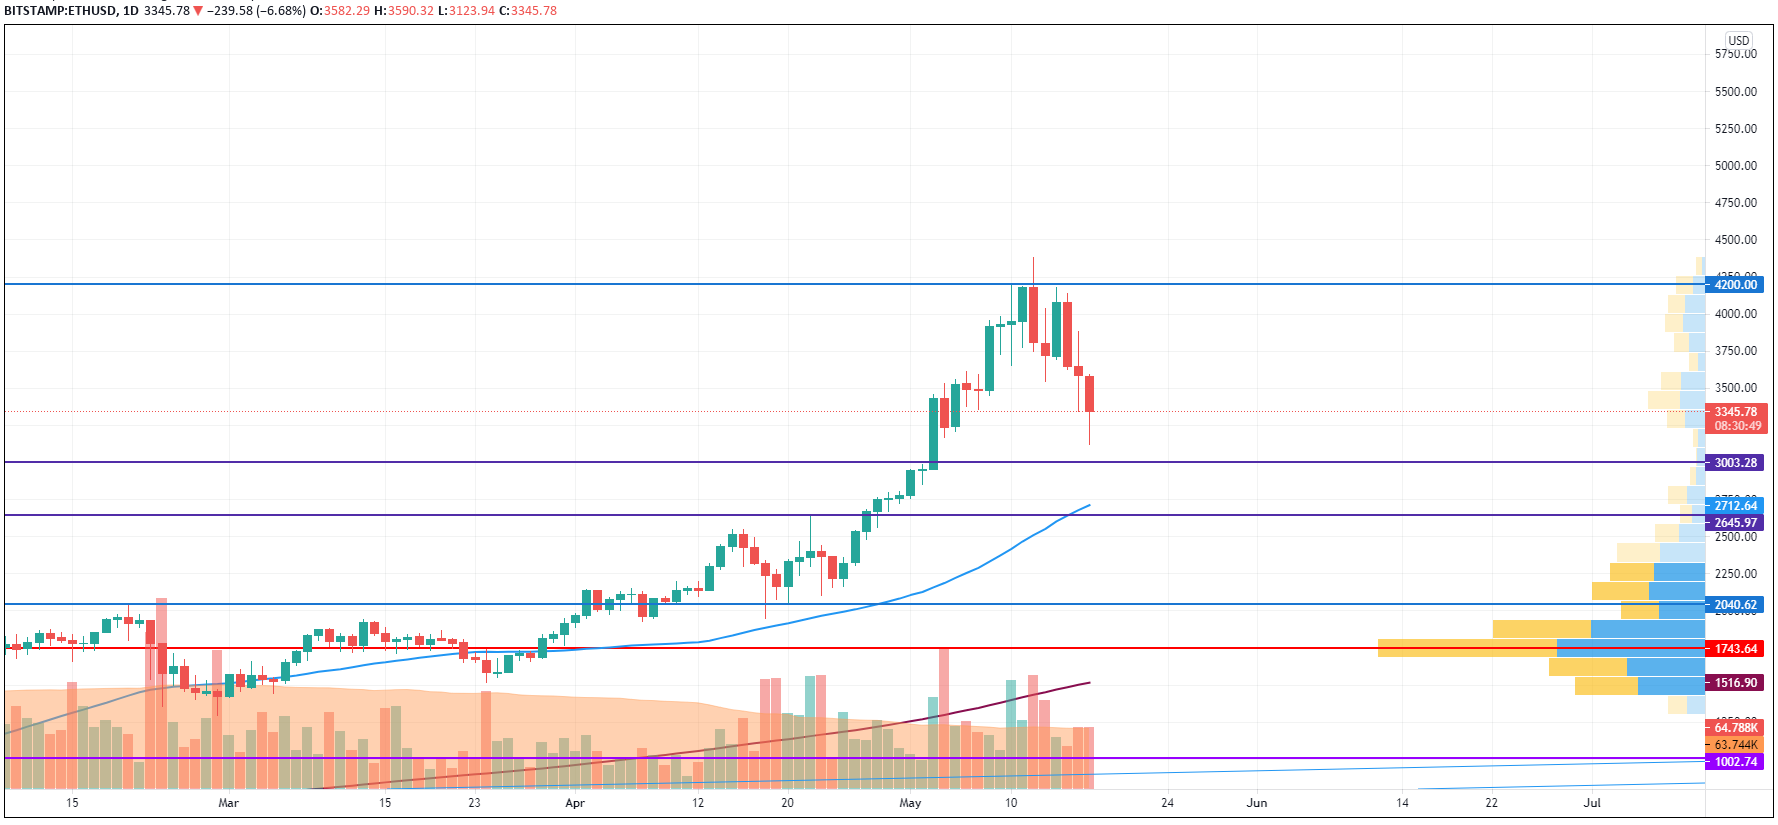
ETH/USD chart by TradingView
Unlike Bitcoin (BTC), Ethereum (ETH) can still face a short-term decline where a bounceback can occur. The drop is accompanied by high trading volume, which means that bears have seized the initiative. In this case, the next zone at which bulls may show growth is the area of $3,000.
Ethereum is trading at $3,343 at press time.
XRP/USD
XRP is less of a loser than Bitcoin (BTC) and Ethereum (ETH) as the price decrease has encompassed only 2% since yesterday.
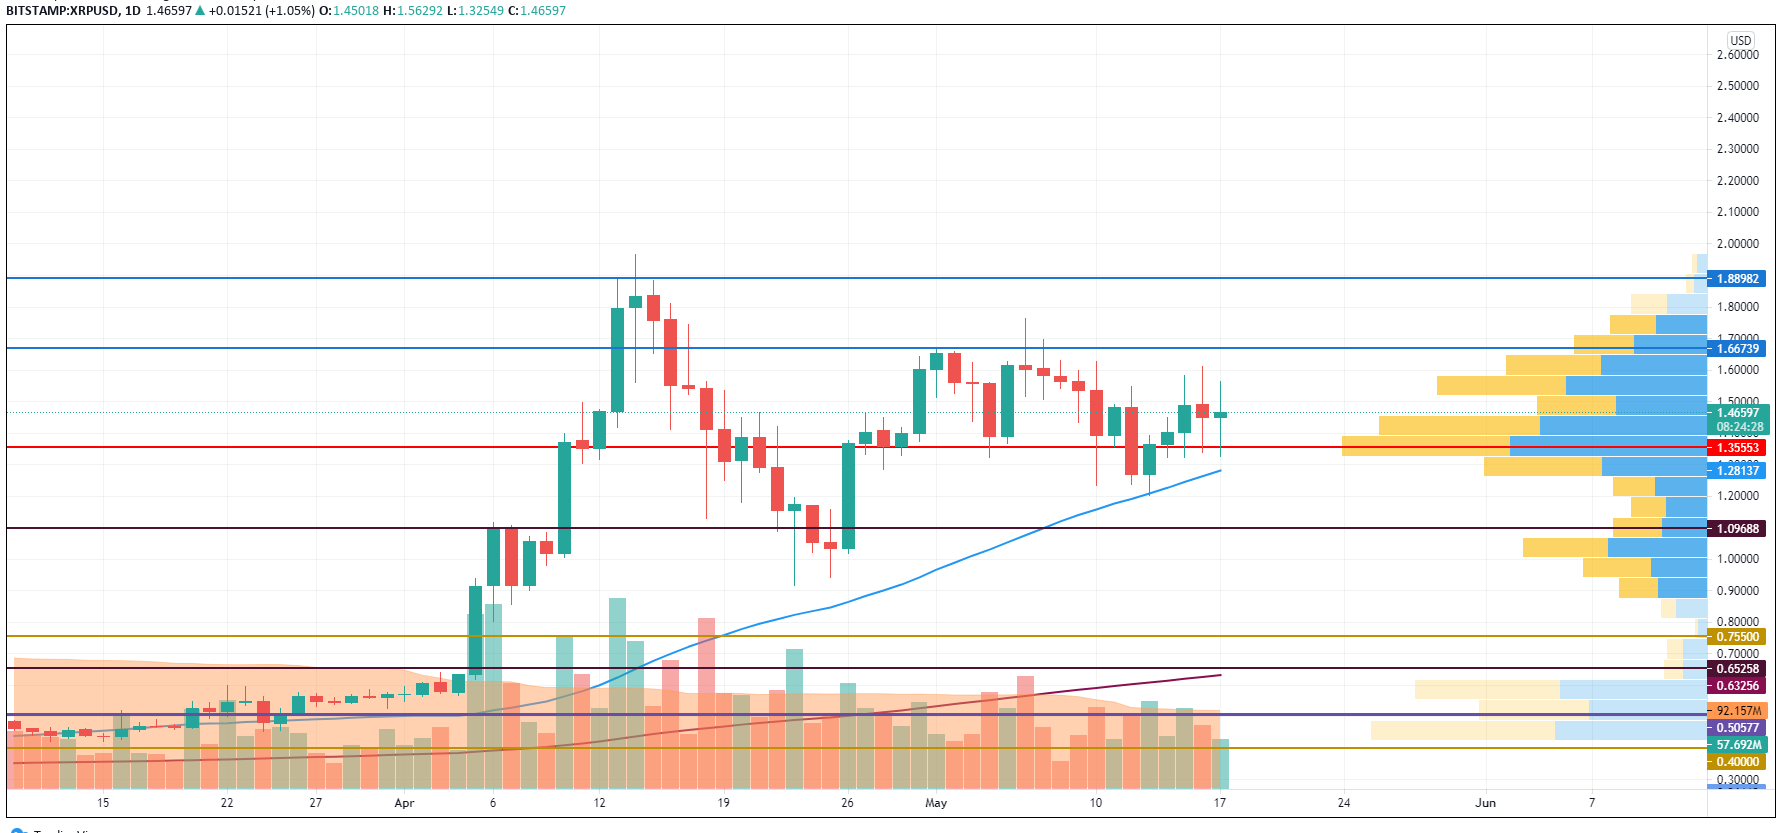
XRP/USD chart by TradingView
From the technical point of view, XRP is looking much stronger than the majority of the top 10 coins. The altcoin has come back to the sideways trend after yesterday's drop. At the moment, neither bulls nor bears control the situation. If the buying trading volume increases, the retest of the resistance at $1.66 may occur soon.
XRP is trading at $1.46 at press time.
ADA/USD
Cardano (ADA) has lost 10% of its price share over the last day.
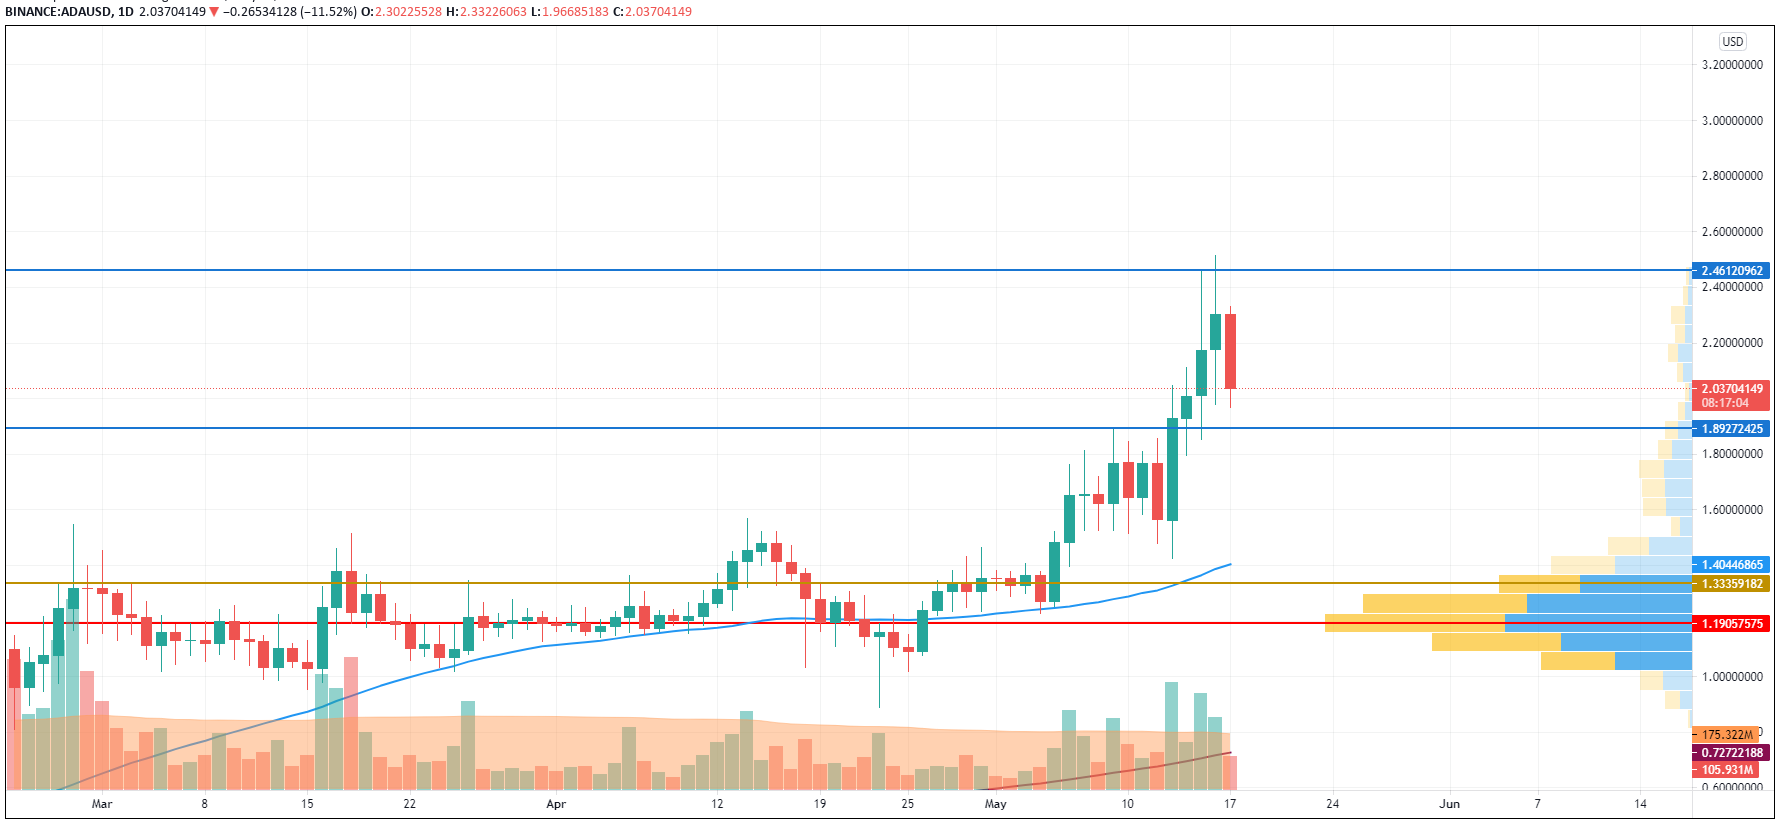
ADA/USD chart by TradingView
Cardano (ADA) could not stay trading above the $2.20 mark, which means that bears have seized the initiative. The selling remains low. However, the retest of the support at $1.89 may occur soon if bulls cannot come back to $2.20.
ADA is trading at $2.04 at press time.
BNB/USD
Binance Coin (BNB) is the top loser today as the price of the native exchange coin has gone down by almost 12%.
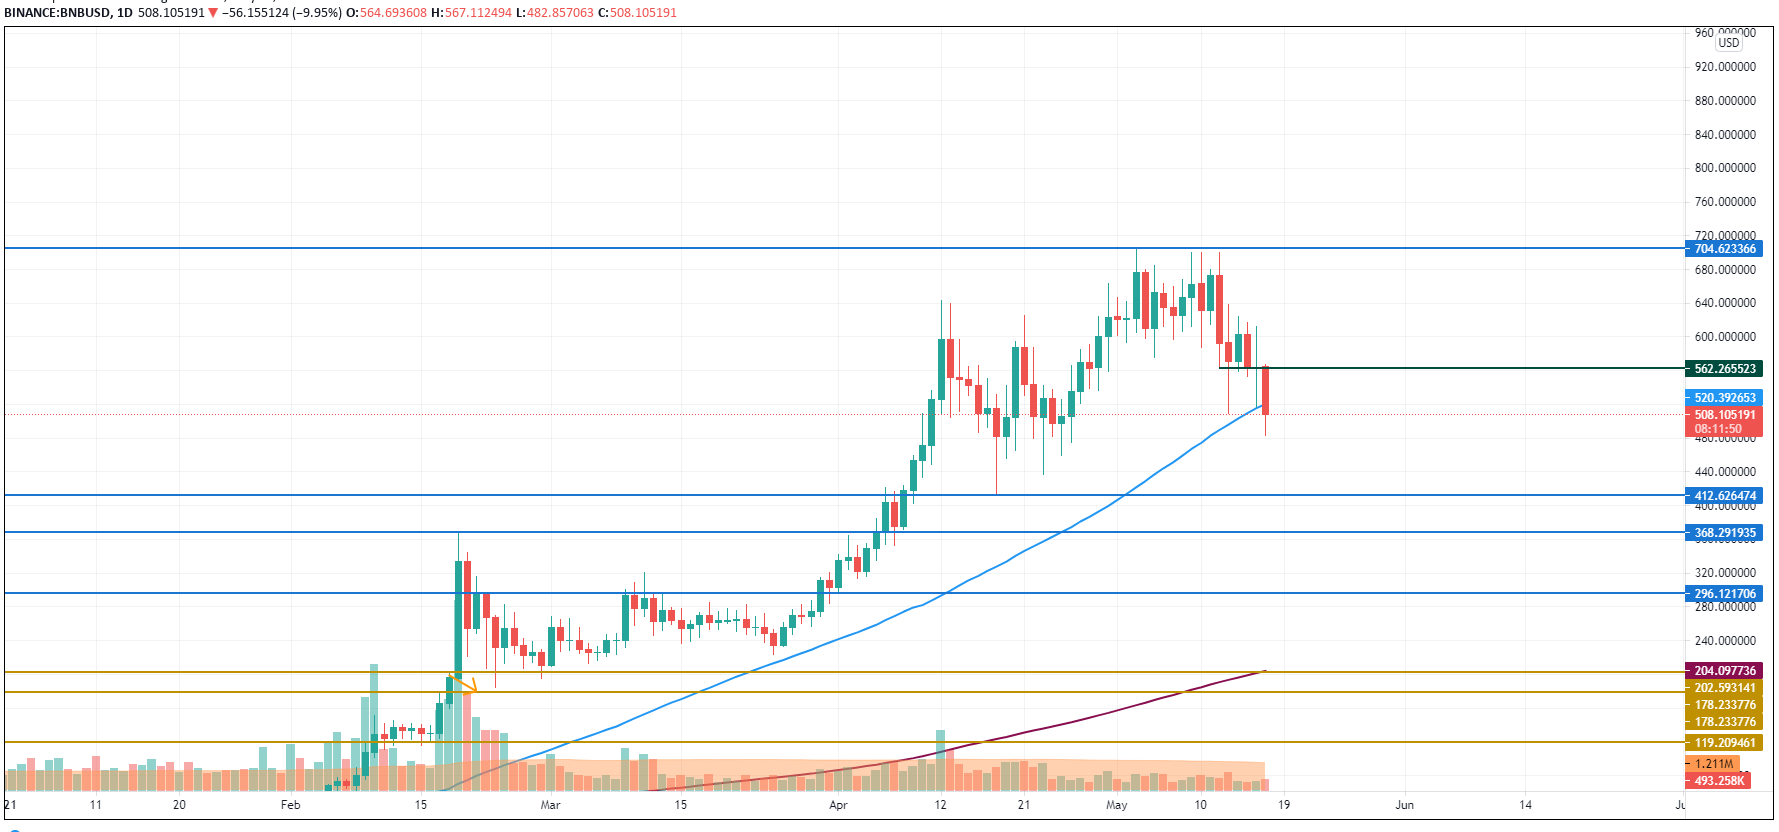
BNB/USD chart by TradingView
Binance Coin (BNB) has failed to keep trading above the MA 50 on the daily time frame. However, the selling trading volume remains low, which means that buyers may return BNB to the created mirror level at $562 very soon.
BNB is trading at $505 at press time.
DOGE/USD
DOGE has not shown such a big drop as the decrease is by 6%.
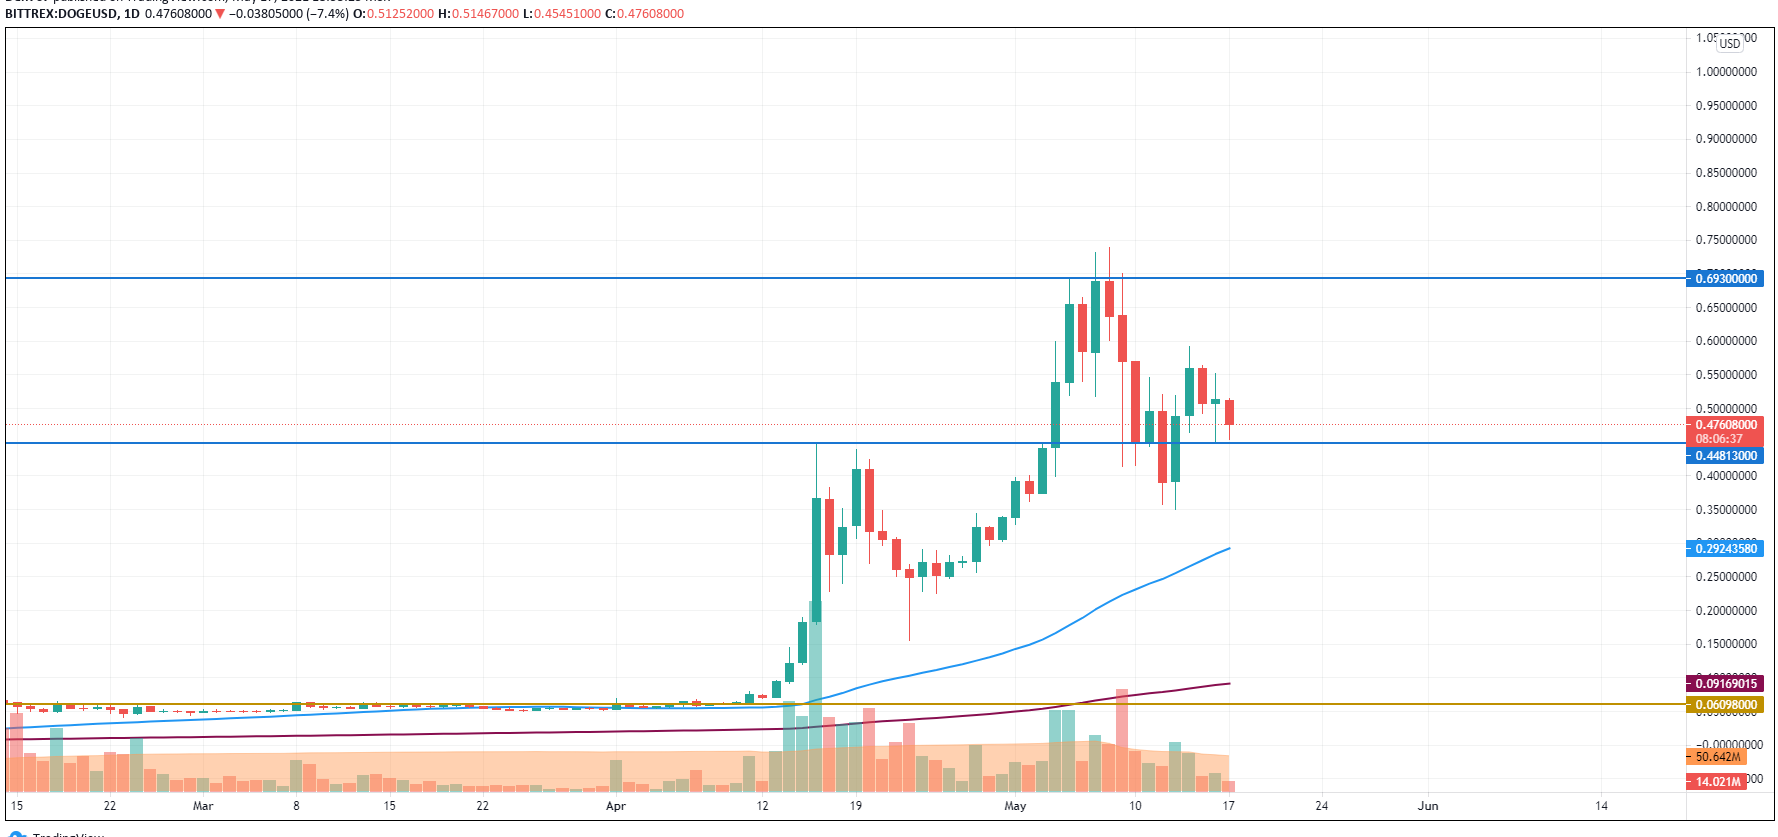
DOGE/USD chart by TradingView
DOGE has tested the support at $0.448 several times, which means there is a high chance to expect it to break out. Thus, the altcoin has been trading near the support for quite a long time, confirming the bears' mood. If a breakout happens, the next support is located in the area of the MA 50 that refers to the mark at $0.29.
DOGE is trading at $0.47 at press time.
Read full original article on U.Today
Author

Denys Serhiichuk
U.Today
With more than 5 years of trading, Denys has a deep knowledge of both technical and fundamental market analysis.


