Is Bitcoin falling in wave three? Sharp drop below 103k – Should you be worried?

Overview
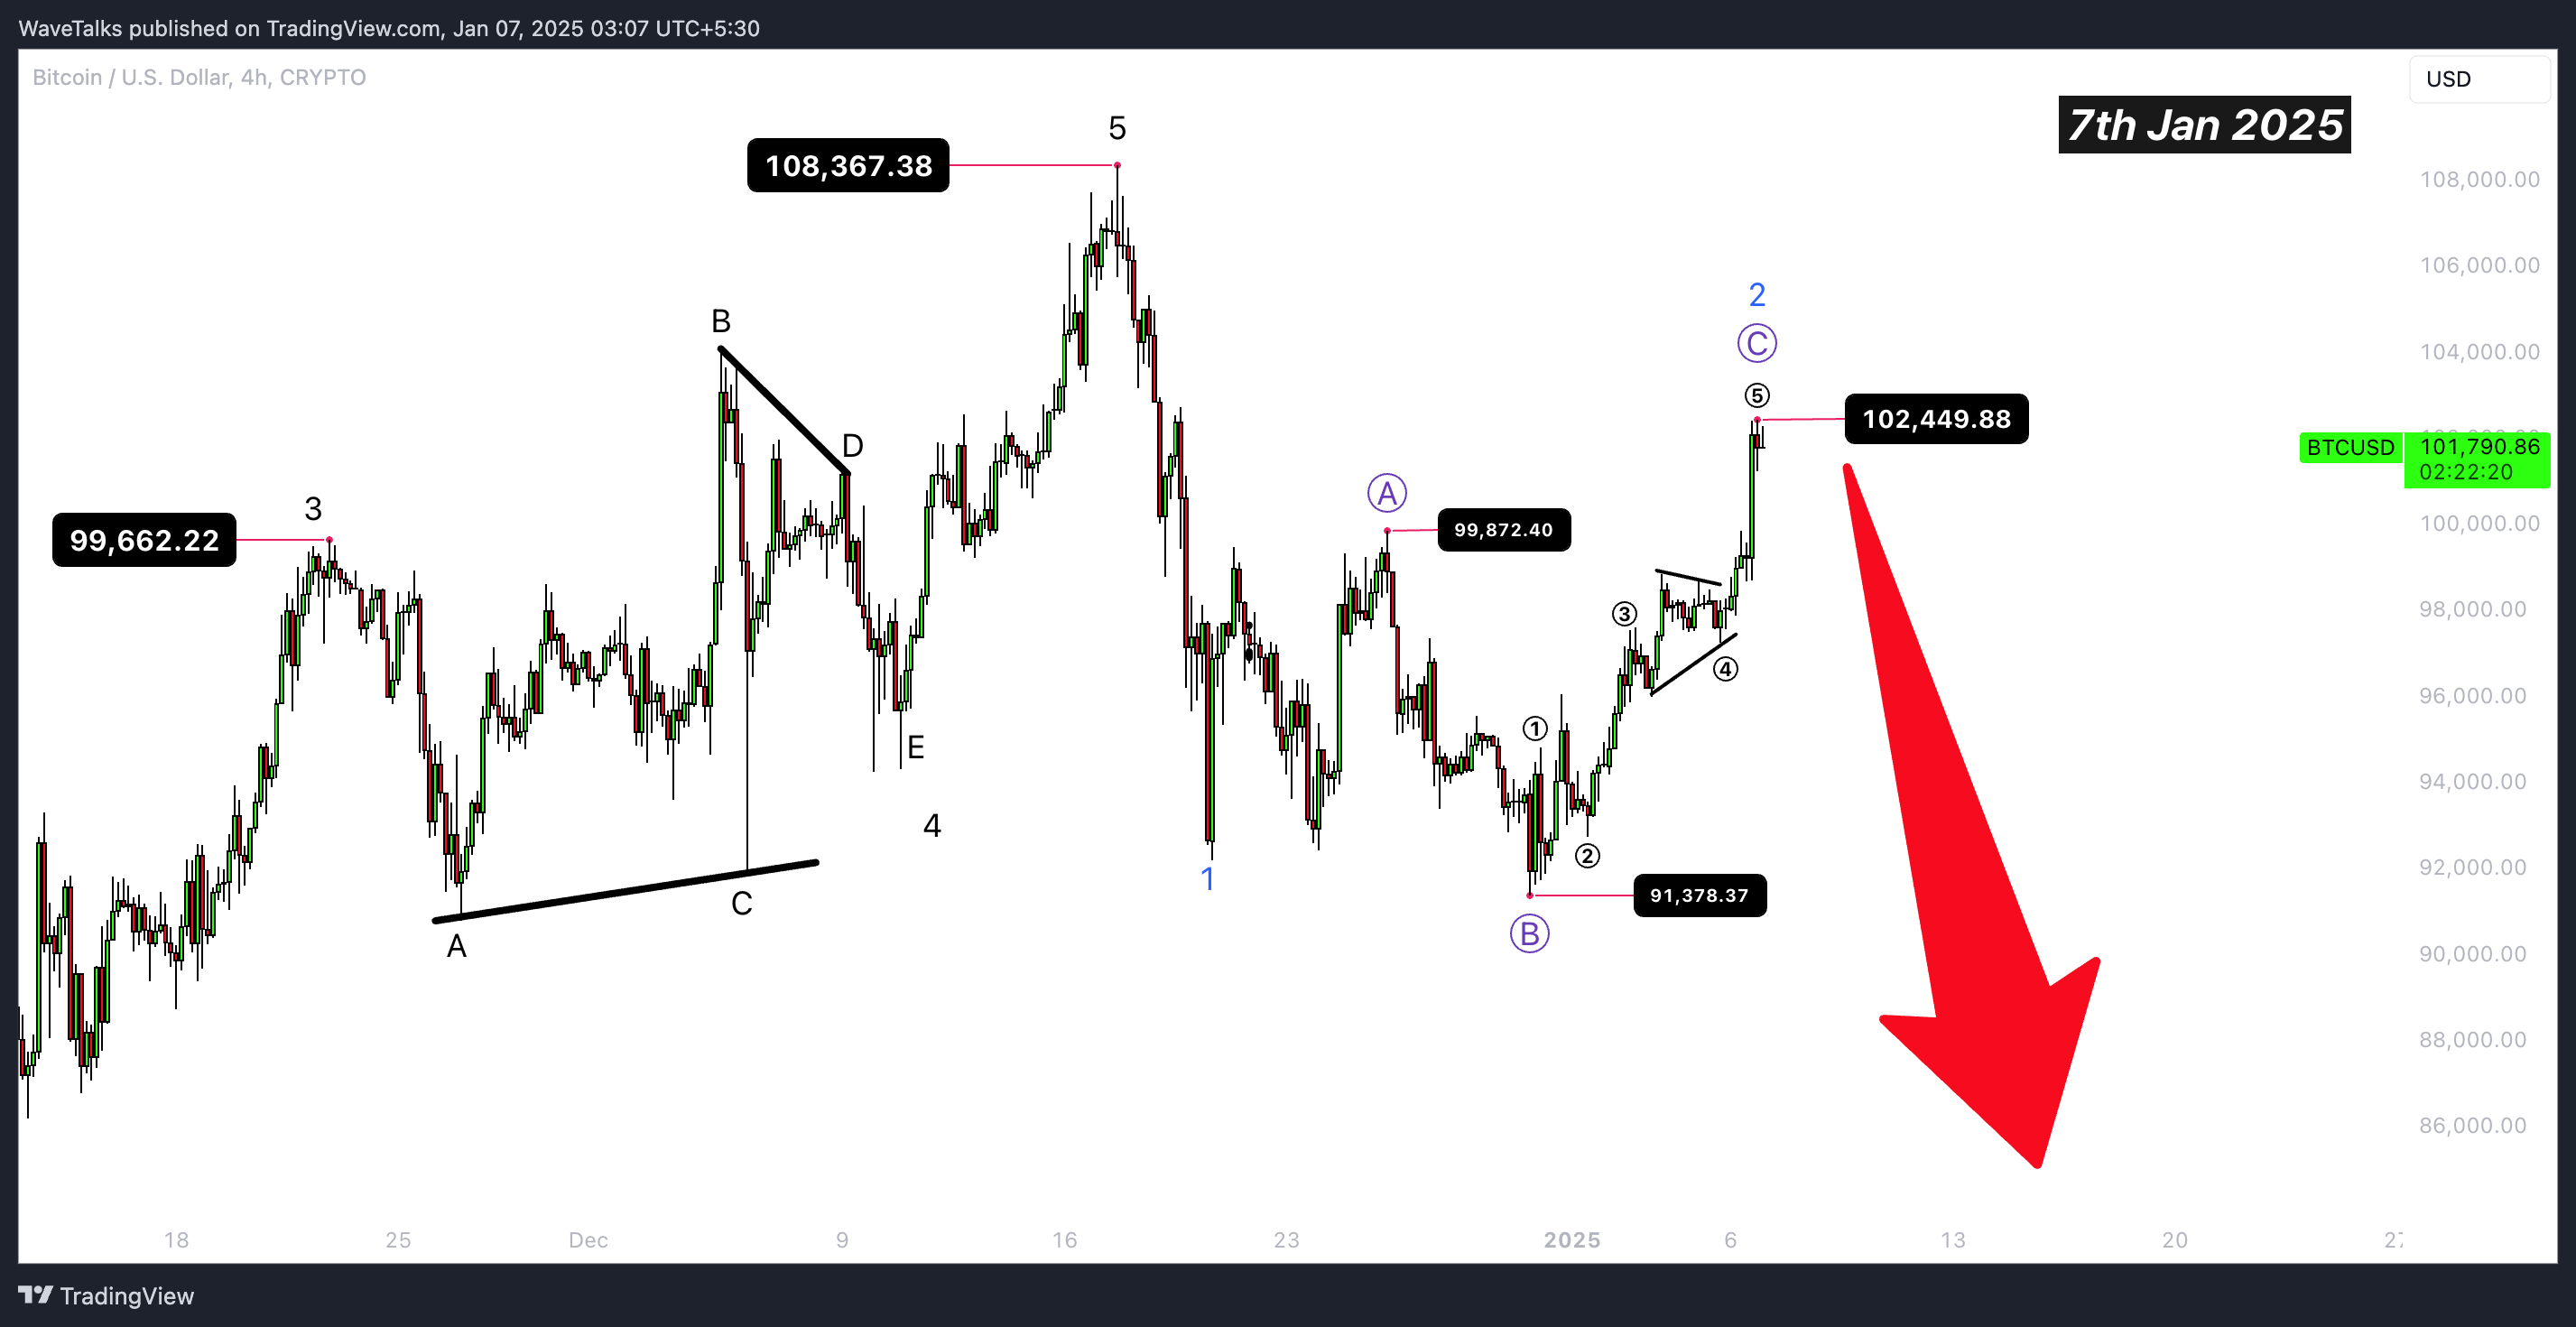
Bitcoin has been on a rollercoaster ride, with sharp movements testing key support and resistance levels. After reaching 103,000, it dropped sharply during the early Asian session on 7th Jan 2025, slipping close to 95,000. This move aligns with the Head & Shoulders pattern discussed in our previous analysis and points to the potential onset of a larger Wave 3 correction.
In this follow-up idea, we explore critical levels, the next likely targets, and actionable strategies for traders.
Recap of key observations
-
Previous analysis:
-
Bitcoin completed a five-wave rally from 52,568 to 108,367, followed by a correction to 92,209 as discussed in the previous idea as of 26th Dec 2024- Did Bitcoin top out at $1,08,367?
-
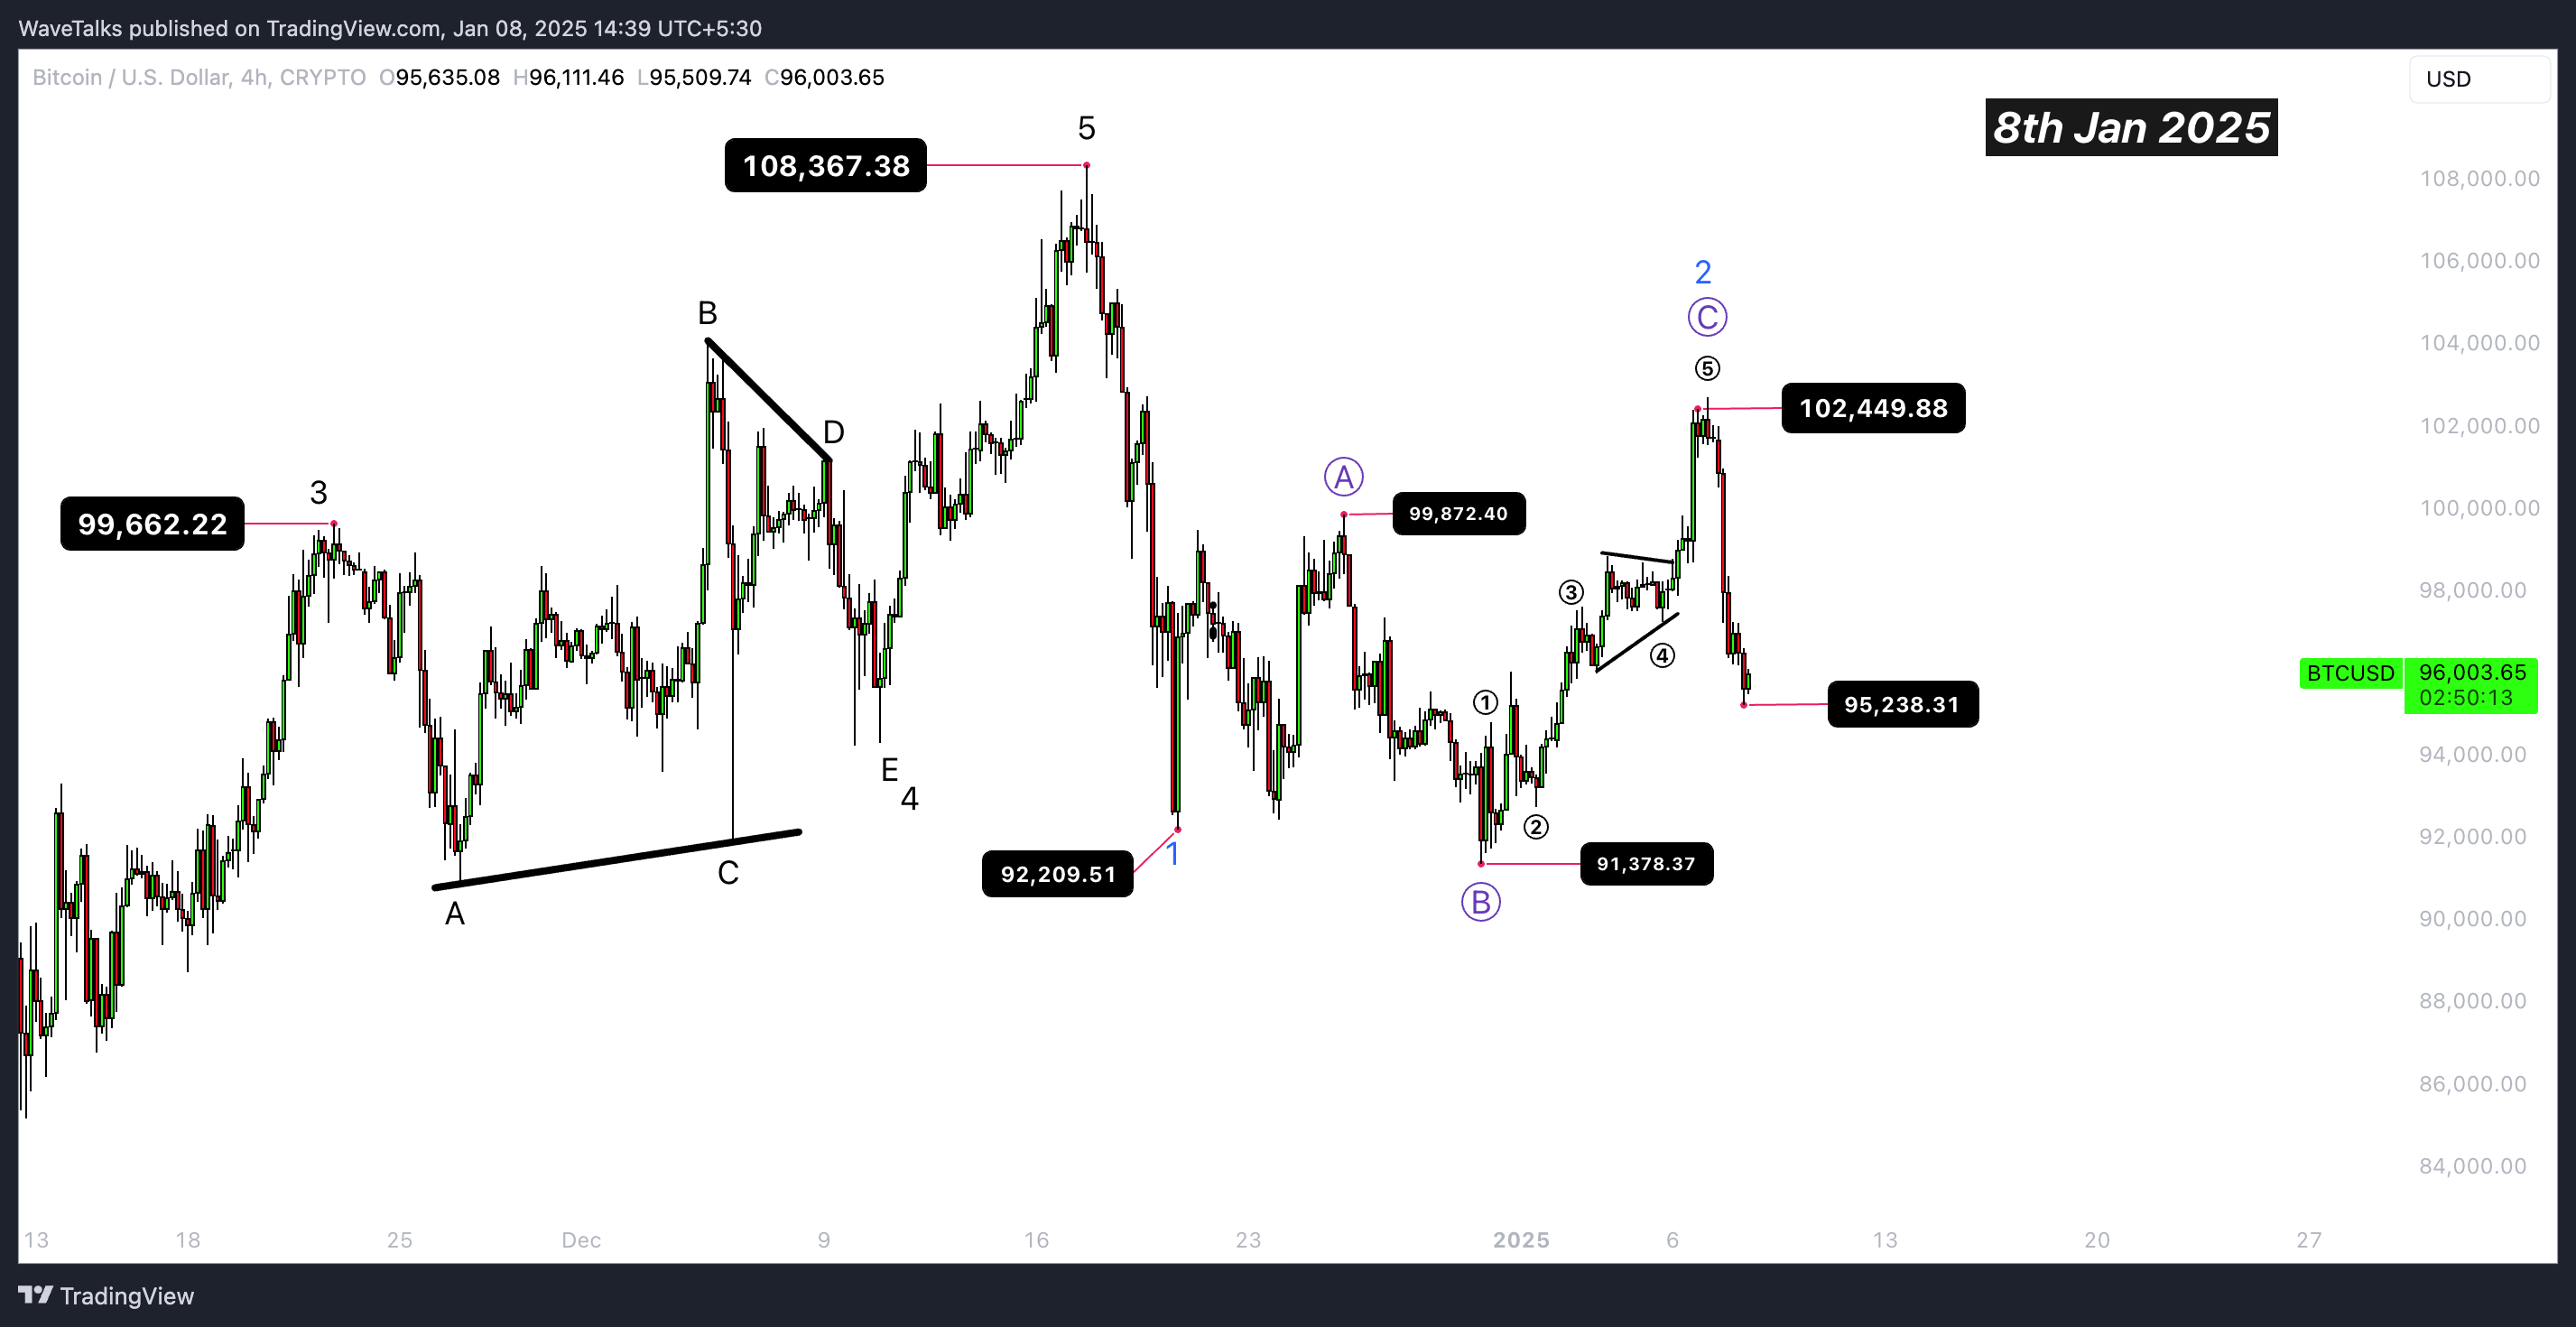
It then formed a larger degree flat correction (Wave ABC), rallying in Wave C from 91,378 to 102,718, shy of 103,000 recently. Previously, we had smaller degree flat as discussed on 26th Dec 2024 Idea on a 30 Mins chart which was a fractal of a larger degree flat which unfolded to the highs of 102718.
-
A potential Head & Shoulders (H&S) pattern emerged, signaling further downside.
-
-
Current scenario:
-
Bitcoin's fall below 95,000 will bring it closer to retesting the recent low of 91,378.
-
Breaching 91,378 could confirm a larger Wave 3 correction, opening the door to lower levels like 85,000 and 75,000.
-
Larger degree flat correction in wave two (Proposed)
Is Bitcoin Falling in Wave 3.
Wave analysis and key levels
Wave structure.
-
Wave ABC: Completed at 102,718, indicating a reversal.
-
Wave 3: Likely underway if Bitcoin breaks below 91,378 decisively.
Key levels.
-
Resistance aones:
-
99,000 - 100,000: Strong resistance that Bitcoin failed to sustain above.
-
102,718 - 103,000: Upper limit before the recent sharp fall started as of 7th Jan 2025
-
-
Support levels:
-
95,000: Minor support, Traders have to watch
-
91,378: A critical level; breaking below confirms bearish momentum.
-
85,000 - 75,000: Next targets based on Fibonacci projections and H&S pattern.
-
Trading strategies
Bearish strategy (Wave 3 Confirmation).
-
Entry: Short below 91,378.
-
Stop Loss: Above 95,000.
-
Targets:
-
85,000
-
75,000
-
Bullish strategy (Breakout above 100K)
-
Entry: Long above 100,000.
-
Stop Loss: Below 98,500.
-
Targets:
-
103,000 - 105,000
-
Retest of 108,367.
-
Neutral strategy (Range play)
-
Buy Near: 91,378, targeting 98,500 with a tight stop below 90,500.
-
Sell Near: 99,000 - 100,000, targeting 92,200 with stops above 100,000.
What’s next?
-
Breaking 91,378: This is the key level to watch. A decisive breakdown will confirm a bearish trend.
-
Larger Wave 3: If Wave 3 unfolds, expect sharper declines toward 85,000 and potentially 75,000.
-
Bullish Reversal: Bitcoin needs to reclaim 100,000 to invalidate the bearish setup.
Conclusion: Bitcoin's sharp drop suggests a bearish wave structure in play. Traders should focus on 91,378 as the decisive level to confirm further downside. Follow our updates for real-time insights as the scenario unfolds.
Author

Abhishek H. Singh
WaveTalks
Abhishek is a seasoned financial analyst with over a decade of experience specializing in Elliott Wave Theory.


