Is Avalanche price setting up for another sell-off?
- Avalanche price shows a bearish divergence between current highs and the highs established in September near $22.
- The Volume Profile Indicator shows the current uptrend as less powerful than the previous decline.
- This thesis remains neutral based on the factors mentioned below.

Avalanche is at a crossroads as the price hovers under a previous support zone. Key levels have been defined to gauge the next move.
Avalanche price at a make-or-break point
AVAX price has rallied 11% during the final week of October. The move north was catalyzed on October 25 as the bulls breached the 8-day exponential and 21-day simple moving averages. An influx of volume accompanies the recent ascension; however, it is not larger than the previous downtrend’s volume pattern.
Avalanche price currently auctions at $17. Multiple doji candles are displayed just below a previously broken support zone. The Relative Strength Index shows the AVAX price at the limits for when a corrective rally becomes an impulsive wave. There is a divergence between the current high and the highs in September at $22.
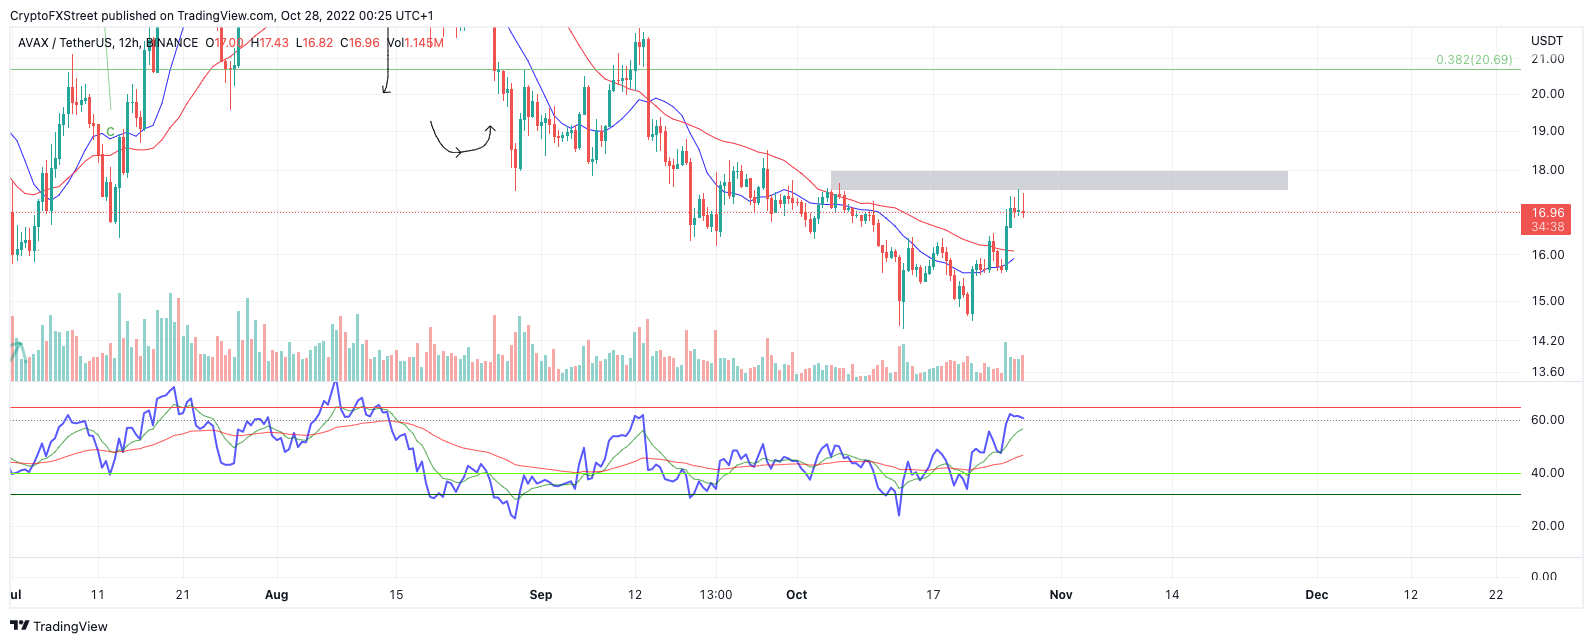
AVAX USDT 12-Hour Chart
Considering these factors, moving in now on the Avalanche price is a risky bet. AVAX will need to hurdle the $18 barrier if the market is genuinely bullish. In doing so, the bulls could continue rallying toward $20 for an additional hike.
On the contrary, failure to cross the newfound resistant level could lead to a liquidation event targeting the lows at $14.70. Such a move would result in a 15% decline from the current market value.
In the following video, our analysts deep dive into the price action of Bitcoin, analyzing key levels of interest in the market. -FXStreet Team
Author

Tony M.
FXStreet Contributor
Tony Montpeirous began investing in cryptocurrencies in 2017. His trading style incorporates Elliot Wave, Auction Market Theory, Fibonacci and price action as the cornerstone of his technical analysis.


