- IOTA has a bearish bias in the short-term.
- An intraday high has been formed at $0.2988 just above the channel resistance.
- The trends of the RSI show the buyers gaining traction against the bulls.
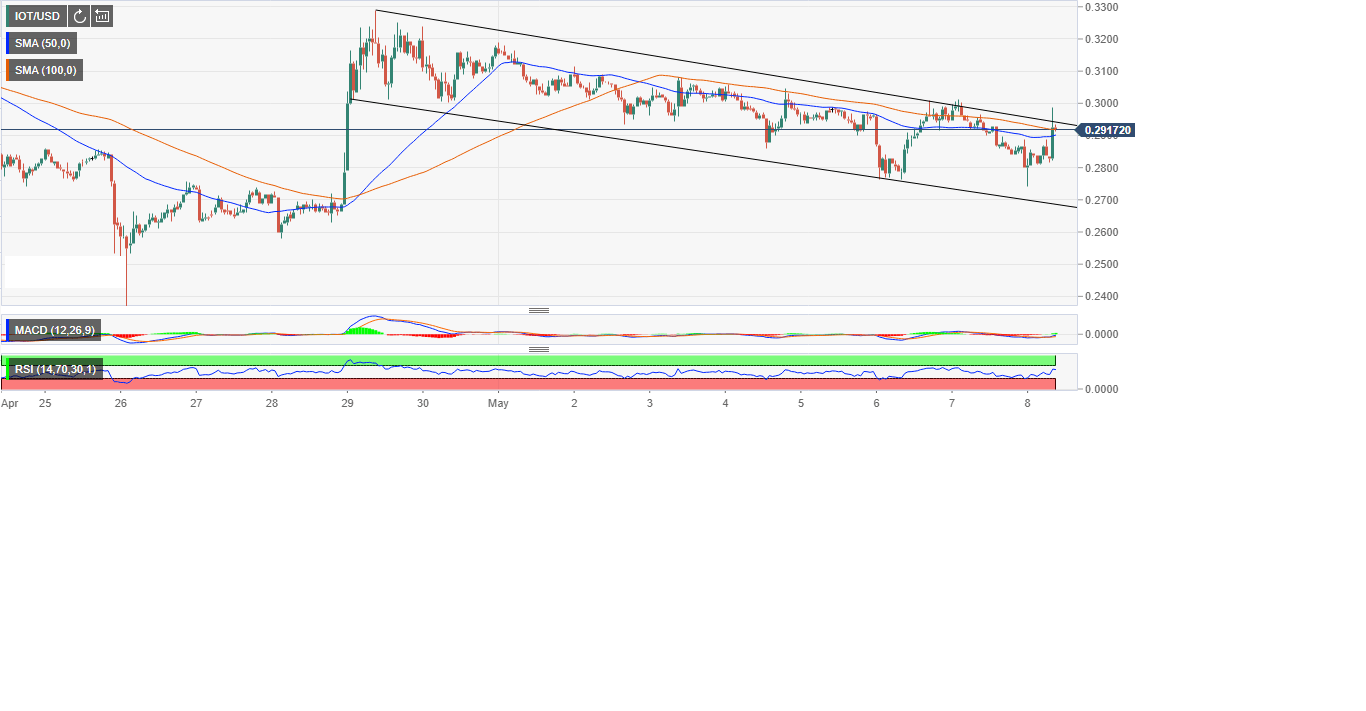
IOTA is currently battling the descending channel resistance that has been capping its upside since April 29 when the surge failed to correct past $0.3293. The price has in the past one week been confined within the falling channel trading lower highs and lower lows. Generally, IOTA has a bearish bias in the short-term unless we can see a formidable rise above the channel resistance.
Recently, IOTA dived to the main support at $0.25 before giving way for an upward move towards $0.3300. A high was formed around $0.3293 resulting in declines. The 100 Simple Moving Average (SMA) has been a critical barrier to the upside with breakouts above it not able to sustain the gains.
Meanwhile, the drop from yesterday’s highs around $0.3000 found support at $0.2800. A correction from the support has pushed the price past both the 50 SMA hurdle and the 100 SMA hurdle. An intraday high has been formed at $0.2988 just above the channel resistance but the price has retreated into the channel to trade at $0.2929 at press time.
The trends of the Relative Strength Index (RSI) shows the buyers gaining traction against the bulls. The slight dips of the indicator inside the oversold has not been able to make significant movements. The RSI has since recovered to 61.76 and still pointing north. The same upward trend is seen in the MACD which is almost breaking into the positive region.
Information on these pages contains forward-looking statements that involve risks and uncertainties. Markets and instruments profiled on this page are for informational purposes only and should not in any way come across as a recommendation to buy or sell in these assets. You should do your own thorough research before making any investment decisions. FXStreet does not in any way guarantee that this information is free from mistakes, errors, or material misstatements. It also does not guarantee that this information is of a timely nature. Investing in Open Markets involves a great deal of risk, including the loss of all or a portion of your investment, as well as emotional distress. All risks, losses and costs associated with investing, including total loss of principal, are your responsibility. The views and opinions expressed in this article are those of the authors and do not necessarily reflect the official policy or position of FXStreet nor its advertisers. The author will not be held responsible for information that is found at the end of links posted on this page.
If not otherwise explicitly mentioned in the body of the article, at the time of writing, the author has no position in any stock mentioned in this article and no business relationship with any company mentioned. The author has not received compensation for writing this article, other than from FXStreet.
FXStreet and the author do not provide personalized recommendations. The author makes no representations as to the accuracy, completeness, or suitability of this information. FXStreet and the author will not be liable for any errors, omissions or any losses, injuries or damages arising from this information and its display or use. Errors and omissions excepted.
The author and FXStreet are not registered investment advisors and nothing in this article is intended to be investment advice.
Recommended Content
Editors’ Picks

Top 3 gainers Supra, Cosmos Hub, EOS: Supra leads recovery after Trump’s tariffs announcement
Supra’s 25% surge on Friday calls attention to lesser-known cryptocurrencies as Bitcoin, Ethereum and XRP struggle. Cosmos Hub remains range-bound while bulls focus on a potential inverse head-and-shoulders pattern breakout.

Bitcoin Weekly Forecast: Tariff ‘Liberation Day’ sparks liquidation in crypto market
Bitcoin price remains under selling pressure around $82,000 on Friday after failing to close above key resistance earlier this week. Donald Trump’s tariff announcement on Wednesday swept $200 billion from total crypto market capitalization and triggered a wave of liquidations.

Can Maker break $1,450 hurdle as whales launch buying spree?
Maker is back above $1,300 on Friday after extending its lower leg to $1,231 the previous day. MKR’s rebound has erased the drawdown that followed United States President Donald Trump’s ‘Liberaton Day’ tariffs on Wednesday, which targeted 100 countries.

Gold shines in Q1 while Bitcoin stumbles
Gold gains nearly 20%, reaching a peak of $3,167, while Bitcoin nosedives nearly 12%, reaching a low of $76,606, in Q1 2025. In Q1, the World Gold ETF's net inflows totalled 155 tonnes, while the Bitcoin spot ETF showed a net inflow of near $1 billion.
Bitcoin Weekly Forecast: Tariff ‘Liberation Day’ sparks liquidation in crypto market
Bitcoin (BTC) price remains under selling pressure and trades near $84,000 when writing on Friday after a rejection from a key resistance level earlier this week.

The Best brokers to trade EUR/USD
SPONSORED Discover the top brokers for trading EUR/USD in 2025. Our list features brokers with competitive spreads, fast execution, and powerful platforms. Whether you're a beginner or an expert, find the right partner to navigate the dynamic Forex market.