Investors can expect big moves from Tezos’ XTZ due to this…
- Tezos price is consolidating inside a developing ascending triangle.
- This technical formation forecasts a 29% upswing to $2.16.
- A decisive daily candlestick close below $1.33 will invalidate the bullish theiss for Tezos.
Tezos price has been coiling up under a stiff resistance barrier for almost a month. The recent recovery has pushed it close to forming a bullish setup that could potentially result in an uptrend.
Tezos price plans its next move
Tezos price broke below the $1.67 support level on June 12. Since then, XTZ crashed 29% to set up a bottom around the $1.17 barrier. As a result, the altcoin embarked on a 41% recovery rally to retest the $1.67 hurdle.
This retest was met with selling pressure that pushed Tezos price lower, but this time, it set up a higher low, relative to $1.17, suggesting an improvement. So far, Tezos has set up two higher lows and one swing high that is retesting the horizontal resistance barrier at $1.67.
Connecting the swing points using trend lines shows the formation of an ascending triangle. This technical formation forecasts a 29% upswing to $2.16, determined by measuring the distance between the first swing high and swing low to the breakout point at $1.67.
However, Tezos price needs to form at least another retest of the $1.67 hurdle to compete the said pattern.
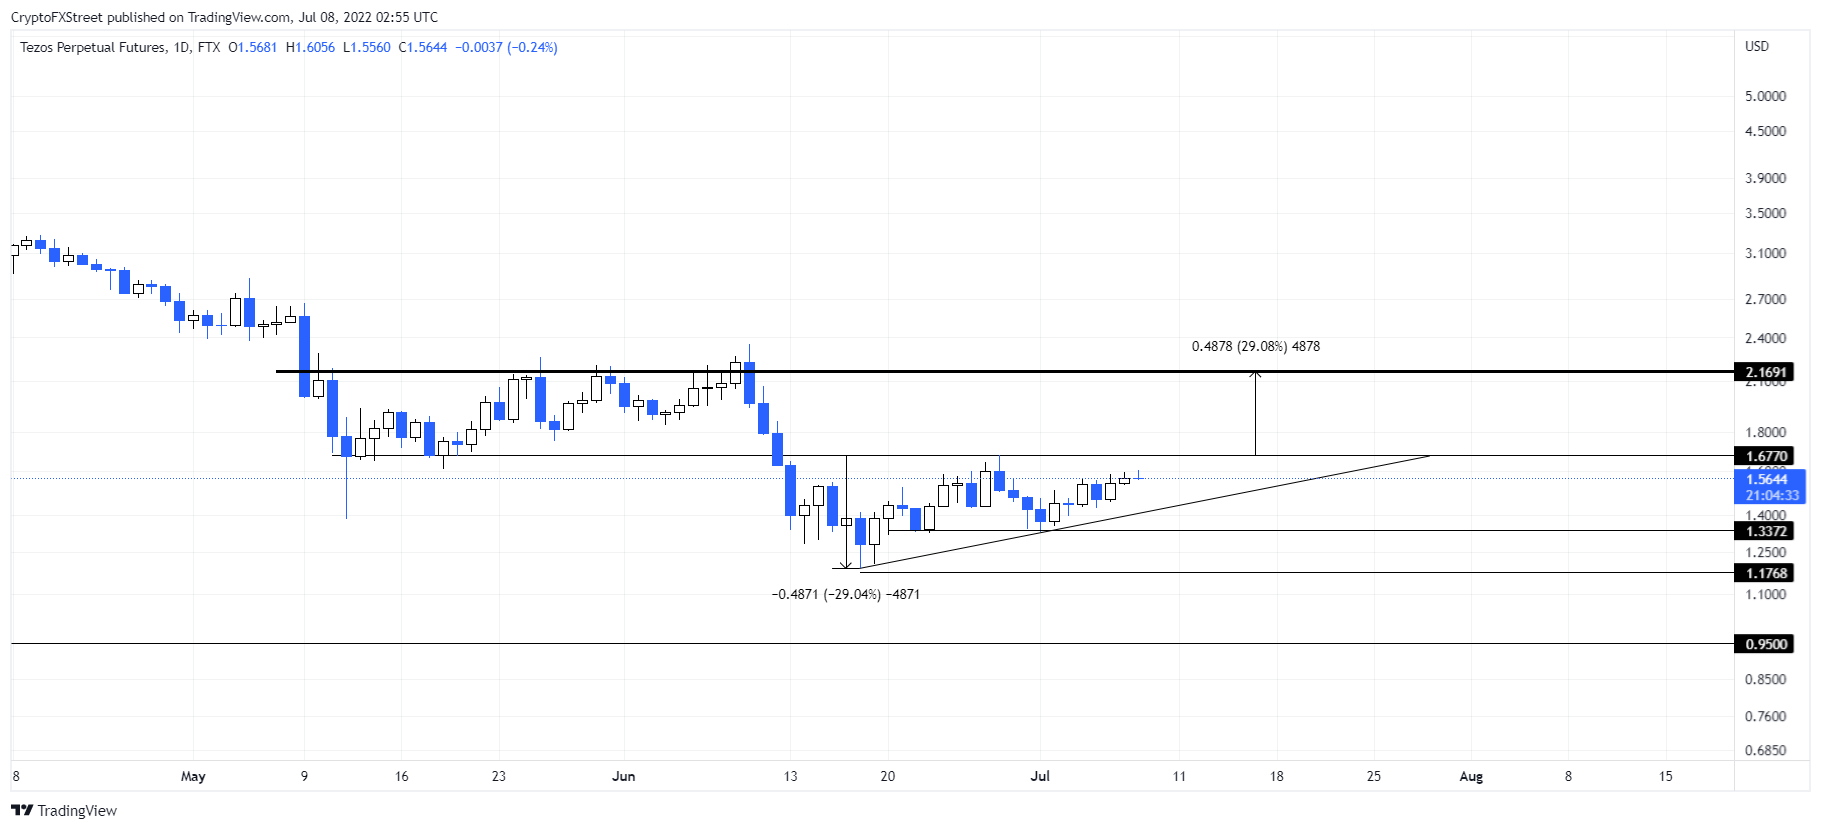
XTZ/USDT 1-day chart
If Tezos price produces a premature breakout above the $1.67 barrier and flips it into a support level, it will also trigger a potential run-up to $2.16.
On the other hand, if Tezos price produces a daily candlestick close below $1.33, it will create a lower low and invalidate the bullish thesis. In such a case, XTZ price might crash 22% to retest the next support level at $1.17.
Author

Akash Girimath
FXStreet
Akash Girimath is a Mechanical Engineer interested in the chaos of the financial markets. Trying to make sense of this convoluted yet fascinating space, he switched his engineering job to become a crypto reporter and analyst.


