- Injective price offers traders a chance to accumulate before the next breakout.
- INJ could rally 15% north to the red zone, where supply overwhelms demand because of seller accumulation.
- A rejection from the supply zone could send INJ down 45% to the market range bottom where the demand zone resides.
Injective (INJ) price is bullish, moving along an uptrend line as investors calculate the outcome that yields the most gains. The price action communicates vision, giving a chance for traders to be part of the next rally.
Also Read: Optimism price could shoot up by 30% after OP whales accumulation spree
Injective price eyes 10% gains, at least
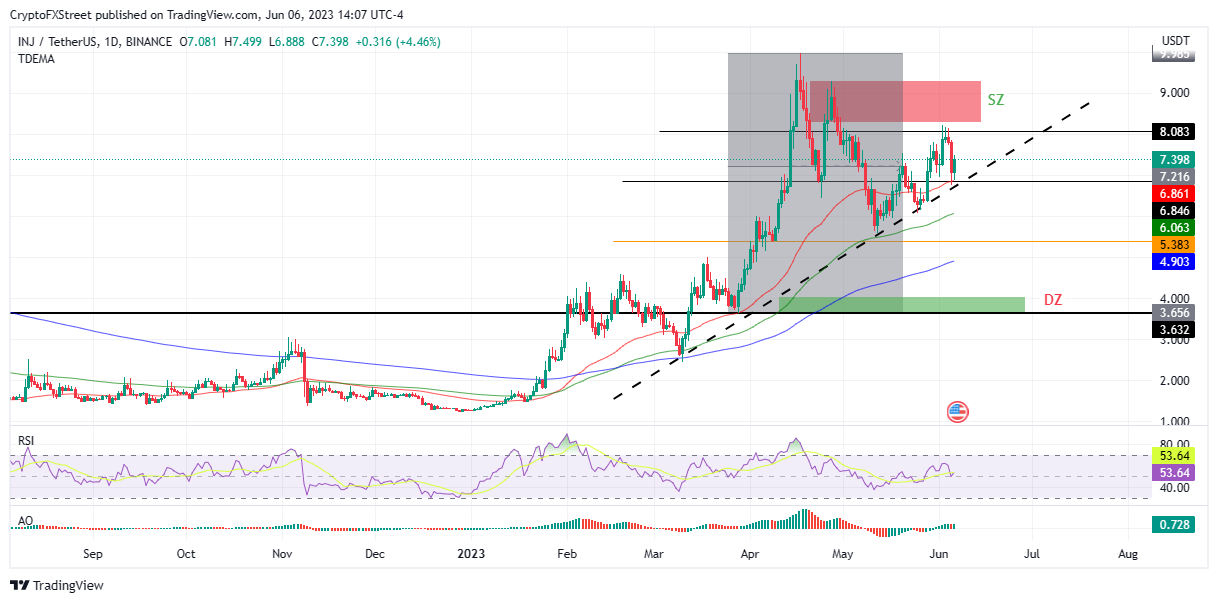
Injective (INJ) price, though stalling at the current $7.44 level, is bullish and presents an opportunity for traders to join the bandwagon before the next breakout happens. The optimism comes as the altcoin continues to sustain above an uptrend line, edging closer to the supply zone (SZ in the daily chart below), where sellers abound.
A supply zone defines the price level where traders typically sell. It is above the current price, with the highest potential or interest to sell. When the price reaches this level, unfilled orders are completed, provoking a decline in the price.
As such, technical analysis indicates that the short-term goal for Injective price lies between the $8.31 and $9.29 range, indicated by the red rectangle. An increase in buyer momentum above this level could see the Injective price rise by at least 10%. Notably, some investors have already identified this buying opportunity.
$INJ / $USD - Update
— Crypto Tony (@CryptoTony__) June 6, 2023
The trigger for the safest entry is simple legends; we enter if the bulls can flip the supply zone at $8.00.
Or you can enter here with a hard stop loss at $6.70, aiming for the supply zone at $8.00. Just keep an eye on any entries you put in pic.twitter.com/SPe1pS4dSj
The Relative Strength Index (RSI), heading north and crossing above the signal line, and the Awesome Oscillators (AO) moving in the positive zone added credence to the optimistic outlook. Both indicators suggested a rising momentum.
INJ/USDT 1-Day Chart
On-chain metrics are optimistic
Santiment data shows a stark growth in daily active addresses, recording a 55% increase between June 1 and 6. Similarly, the volume is up 25% over the same period.
Conversely, early profit-taking could interrupt the rally, akin to what happened between June 2 and 3, leading to a correction. The ensuing selling pressure could see the Injective price fall below the confluence of the 50-day Exponential Moving Average (EMA) and the uptrend line at around $6.84.
Failure to hinge around the 100-EMA at $6.06, like on May 12, could see the Injective price drop further, potentially breaching the 200-day EMA at $4.90 before tagging the demand zone (DZ) marked in green. This would be a possible recovery base for INJ as this is where buyers would swarm.
Information on these pages contains forward-looking statements that involve risks and uncertainties. Markets and instruments profiled on this page are for informational purposes only and should not in any way come across as a recommendation to buy or sell in these assets. You should do your own thorough research before making any investment decisions. FXStreet does not in any way guarantee that this information is free from mistakes, errors, or material misstatements. It also does not guarantee that this information is of a timely nature. Investing in Open Markets involves a great deal of risk, including the loss of all or a portion of your investment, as well as emotional distress. All risks, losses and costs associated with investing, including total loss of principal, are your responsibility. The views and opinions expressed in this article are those of the authors and do not necessarily reflect the official policy or position of FXStreet nor its advertisers. The author will not be held responsible for information that is found at the end of links posted on this page.
If not otherwise explicitly mentioned in the body of the article, at the time of writing, the author has no position in any stock mentioned in this article and no business relationship with any company mentioned. The author has not received compensation for writing this article, other than from FXStreet.
FXStreet and the author do not provide personalized recommendations. The author makes no representations as to the accuracy, completeness, or suitability of this information. FXStreet and the author will not be liable for any errors, omissions or any losses, injuries or damages arising from this information and its display or use. Errors and omissions excepted.
The author and FXStreet are not registered investment advisors and nothing in this article is intended to be investment advice.
Recommended Content
Editors’ Picks
Ripple on-chain metrics show bullish signs amidst legal struggle with SEC, XRP eyes recovery
Ripple made a comeback above $0.48 on Tuesday and hovers above that level in Wednesday’s European session. Ripple on-chain metrics such as transaction volume and Network Realized Profit/Loss have turned bullish, supporting a recovery in the altcoin.
Bitcoin price falls amidst German government transfers, miners activity
Bitcoin (BTC) extends correction on Wednesday and hovers around $61,000 after finding resistance near the $64,000 level on Monday. Recent on-chain data indicates heightened selling activity from Bitcoin miners early in the week.
Crypto Today: Bitcoin erases gains from end of June, Ethereum declines while Ripple holds
Bitcoin wipes out gains from the last week of June and falls below $60,000 on Wednesday. Ethereum and top altcoins ranked by market capitalization erased gains as the inflation outlook worsened. Ripple holds on to recent gains and hovers above $0.48 on Wednesday.
Three reasons why altcoins could shake off losses this week
On-chain data from Santiment shows that altcoins are currently in the opportunity zone, or generating buy signals. The top three altcoins in the buy zone are Basic Attention Token (BAT), Chromia (CHR), and Highstreet (HIGH), per Santiment.
Bitcoin: BTC price correction could end in July, according to seasonal data
Bitcoin (BTC) price appears poised for a decline this week, influenced by slight outflows in US spot ETFs, selling activity among BTC miners, and a combined transfer of 4,690.28 BTC to centralized exchanges by the US and German governments.