Injective price braces for volatility ahead of nearly $150 million worth of INJ token unlocks


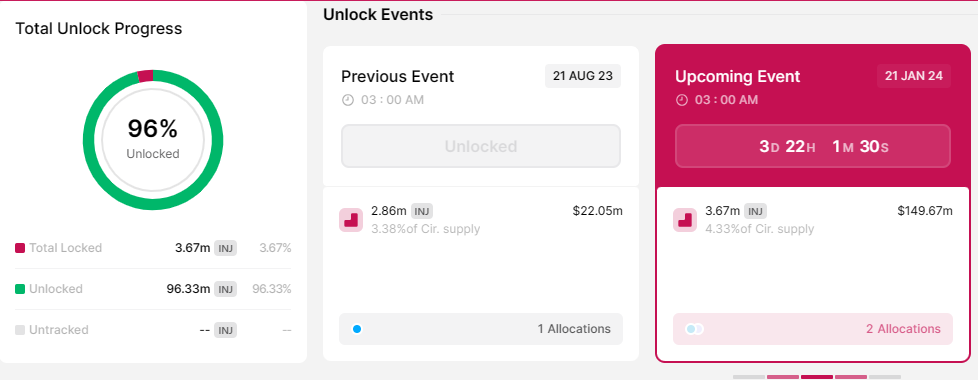
  • Injective price could record volatility soon as 3.67 million INJ tokens worth 148.72 million are due to flood markets in a cliff unlock.
  • Token allocation to the team and investors may not inspire immediate profit booking, but increased supply will definitely impact markets.
  • A similar event on August 21 influenced the AI crypto coin’s price with significant fluctuations before and after the unlocks.

Injective (INJ) price has been trading within a range over the past several days, consolidating within the confines of two levels with profit taking and investors buying the correction keeping INJ within range. The AI crypto coin, which is built atop the Cosmos blockchain cold register increasing volatility soon with a token unlocks event due on January 21.

Also Read: Injective price hits new all-time high at $39.97, INJ sustains uptrend despite profit-taking

Injective price prepares for massive token unlocks

Token unlocks are generally considered to be a bearish event since the market witnesses a surge in the supply of an asset. With the increase in supply and static demand, the value of the asset decreases, and this generally results in the price dropping.

On January 21, the Injective network will unleash 3.67 million INJ tokens to the market, worth $148.72 million at current rates. The volume of unlocks constitutes 4.33% of the network’s entire supply with allocations going to advisors and the team, with the latter expected to receive the lion’s share of the allocation.  While these recipients may not be quick to cash in, some selling pressure is expected nonetheless.

INJ token unlocks

Injective price outlook with millions’ worth INJ tokens due to flood markets soon

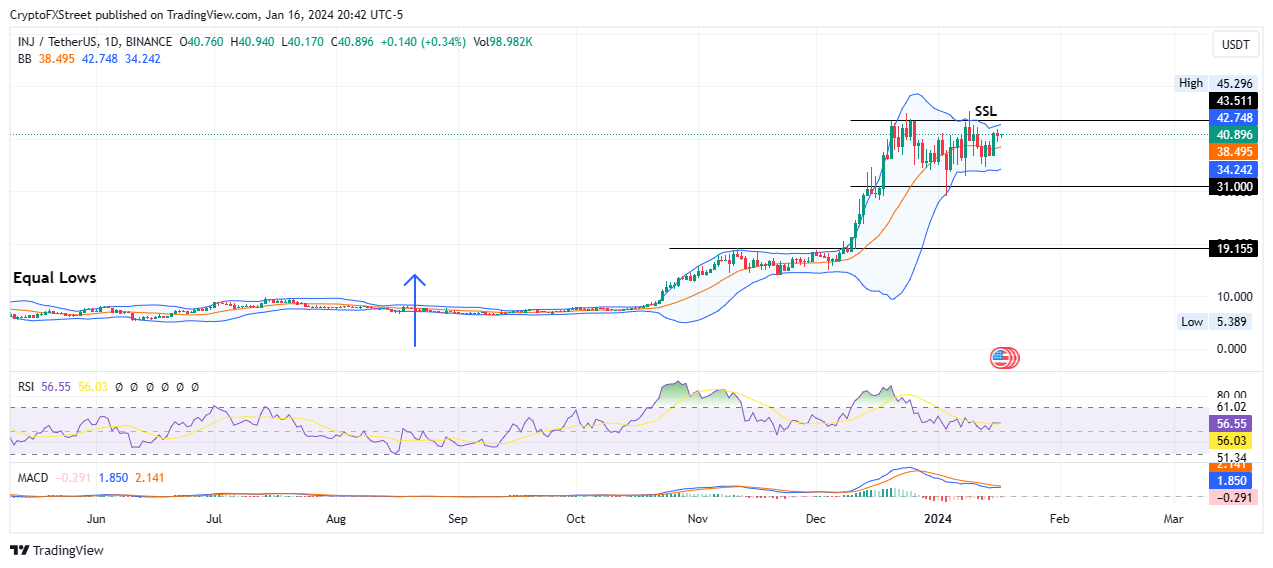
Injective price has been consolidating between the $31.00 and $43.51 levels since December 20, a wide range that could soon narrow with expected increasing volatility. The token’s price is moving within the confines of the Bollinger indicator, sitting atop the support offered by the centerline of the indicator at $38.49 while confronting its upper band at $42.74.

The Relative Strength Index (RSI) is southbound, showing falling momentum, and could soon cross below its signal line (yellow band), marking a bearish crossover if the trajectory sustains. The Moving Average Convergence Divergence (MACD) is also moving below the signal line (orange band) after crossing below it on December 27. These show that the odds favor the downside.

If the bears have their say, Injective price could lose the support due to the centerline of the Bollinger indicator, potentially tagging its lower band at $34.24. In the dire case, the slump could see INJ test the $31.00 support level.

INJ/USDT 1-day chart

On the flip side, increased buying pressure could send Injective price north, likely clearing the upper Bollinger band at $42.78 before tagging the $43.51 resistance level. A break and close above this level, which would start as a liquidity collection exercise, could see INJ record a higher high and potentially reach the $45.296 range high, standing 25% above current levels.


Information on these pages contains forward-looking statements that involve risks and uncertainties. Markets and instruments profiled on this page are for informational purposes only and should not in any way come across as a recommendation to buy or sell in these assets. You should do your own thorough research before making any investment decisions. FXStreet does not in any way guarantee that this information is free from mistakes, errors, or material misstatements. It also does not guarantee that this information is of a timely nature. Investing in Open Markets involves a great deal of risk, including the loss of all or a portion of your investment, as well as emotional distress. All risks, losses and costs associated with investing, including total loss of principal, are your responsibility. The views and opinions expressed in this article are those of the authors and do not necessarily reflect the official policy or position of FXStreet nor its advertisers. The author will not be held responsible for information that is found at the end of links posted on this page.

If not otherwise explicitly mentioned in the body of the article, at the time of writing, the author has no position in any stock mentioned in this article and no business relationship with any company mentioned. The author has not received compensation for writing this article, other than from FXStreet.

FXStreet and the author do not provide personalized recommendations. The author makes no representations as to the accuracy, completeness, or suitability of this information. FXStreet and the author will not be liable for any errors, omissions or any losses, injuries or damages arising from this information and its display or use. Errors and omissions excepted.

The author and FXStreet are not registered investment advisors and nothing in this article is intended to be investment advice.

Join Telegram

Recommended content


Recommended Content

Editors’ Picks

Ripple on-chain metrics show bullish signs amidst legal struggle with SEC, XRP eyes recovery

Ripple on-chain metrics show bullish signs amidst legal struggle with SEC, XRP eyes recovery

Ripple made a comeback above $0.48 on Tuesday and hovers above that level in Wednesday’s European session. Ripple on-chain metrics such as transaction volume and Network Realized Profit/Loss have turned bullish, supporting a recovery in the altcoin. 

More Ripple News

Bitcoin price falls amidst German government transfers, miners activity

Bitcoin price falls amidst German government transfers, miners activity

Bitcoin (BTC) extends correction on Wednesday and hovers around $61,000 after finding resistance near the $64,000 level on Monday. Recent on-chain data indicates heightened selling activity from Bitcoin miners early in the week. 

More Bitcoin News

Crypto Today: Bitcoin erases gains from end of June, Ethereum declines while Ripple holds

Crypto Today: Bitcoin erases gains from end of June, Ethereum declines while Ripple holds

Bitcoin wipes out gains from the last week of June and falls below $60,000 on Wednesday. Ethereum and top altcoins ranked by market capitalization erased gains as the inflation outlook worsened. Ripple holds on to recent gains and hovers above $0.48 on Wednesday. 

More Cryptocurrencies News

Three reasons why altcoins could shake off losses this week

Three reasons why altcoins could shake off losses this week

On-chain data from Santiment shows that altcoins are currently in the opportunity zone, or generating buy signals. The top three altcoins in the buy zone are Basic Attention Token (BAT), Chromia (CHR), and Highstreet (HIGH), per Santiment. 

More Altcoins News

Bitcoin: BTC price correction could end in July, according to seasonal data

Bitcoin: BTC price correction could end in July, according to seasonal data

Bitcoin (BTC) price appears poised for a decline this week, influenced by slight outflows in US spot ETFs, selling activity among BTC miners, and a combined transfer of 4,690.28 BTC to centralized exchanges by the US and German governments.

Read full analysis

BTC

ETH

XRP