If Ethereum price cannot make it past $1,800, ETH could crash 15%
- Ethereum price would need to push past $1,718 in order to flip $1,760 into a support floor.
- The growing bearishness on price indicators suggests ETH could correct and invalidate the recent recovery to decline to $1,423
- If the altcoin breaches $1,718, it will invalidate the bearish thesis, pushing the price toward $1,800.

Ethereum price has been in a macro uptrend even when most of the other altcoins have been stuck in consolidation. The consistent rise in price has already helped ETH recover its losses from November 2022. Investors are now optimistic about a further recovery which is visible in the market’s sentiment as well.
The Crypto Fear and Greed index, which highlights the active sentiment in the market, recovered from a state of fear starting in January. The index is currently indicating rising greed in the market which could result in buyers pushing the price higher. However, in the case of Ethereum, price indicators might have something different to say.
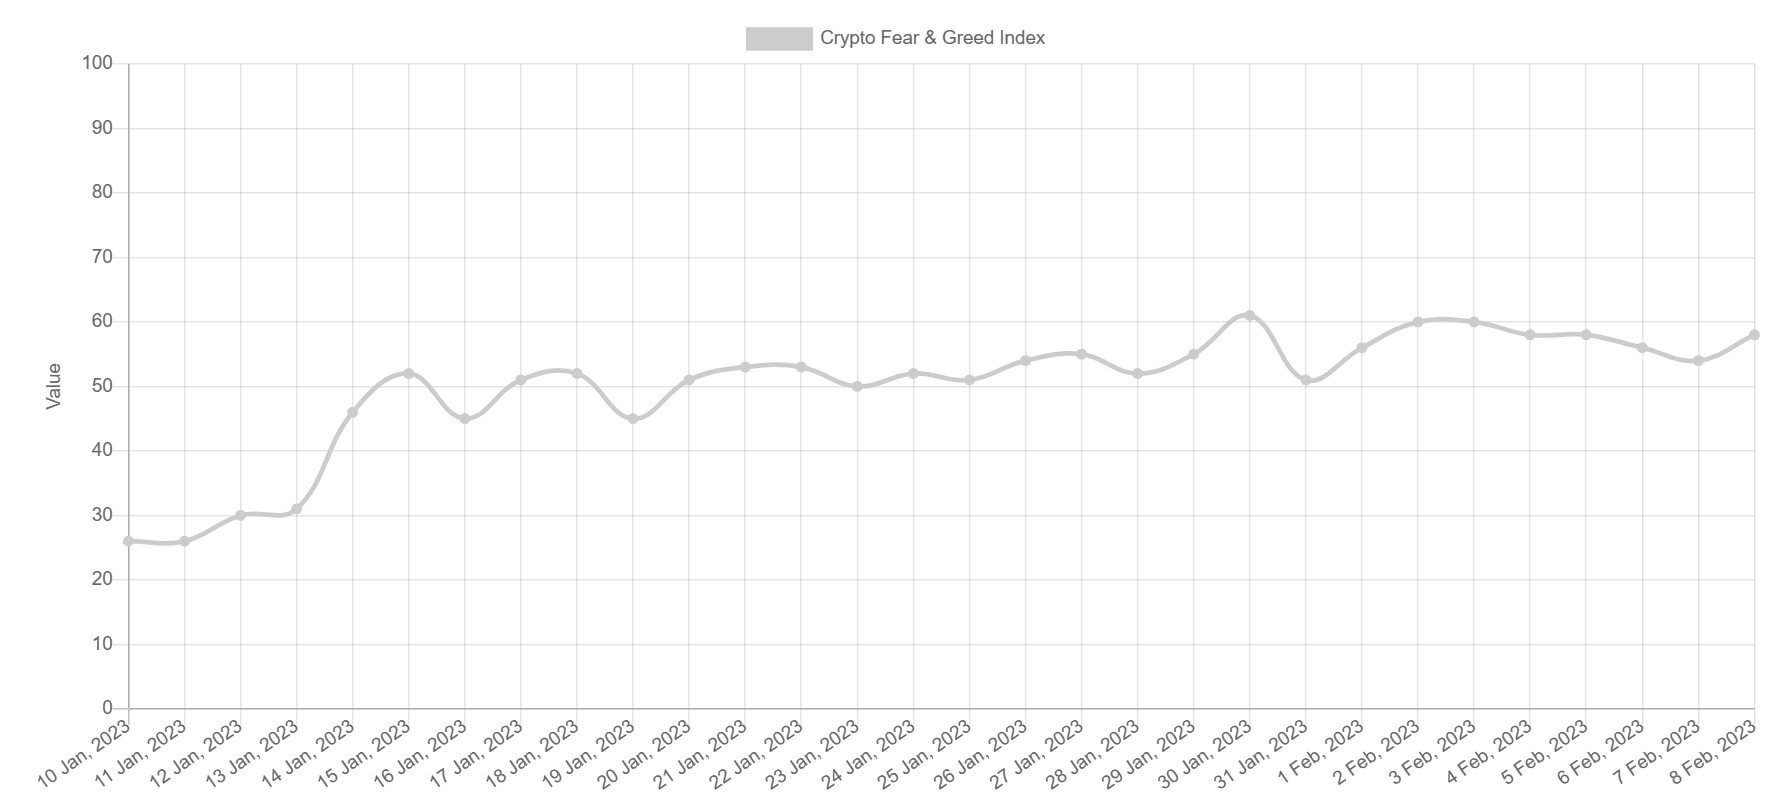
Crypto Fear and Greed Index
Ethereum price set for a breach or slip
Ethereum price has risen by nearly 40% in the span of a month to trade at $1,672 at the time of writing. Penetrating the resistance block from $1,641 to $1,761, the altcoin king is advancing toward tagging the critical resistance at the upper limit of the block.
However, before the Ethereum price flips $1,761 into support, the cryptocurrency will have to breach the resistance level of $1,718. The last time ETH managed even to tag the critical resistance level was almost six months ago, and since then, attempts failed before $1,641 could be turned into a support floor. This is the likely route the Ethereum price might take going forward, as price indicators support the same bearish outlook.
The Moving Average Convergence Divergence (MACD) indicator maintains the bearish crossover it noted about ten days ago. The signal line (red) crossing over the MACD line (blue) suggested a change in trend could be incoming.
Secondly, the Parabolic Stop and Reverse (SAR) indicator is losing the strength of its active uptrend. The blue dots of the indicator will move above the candlesticks if ETH faces rejection at $1,718.
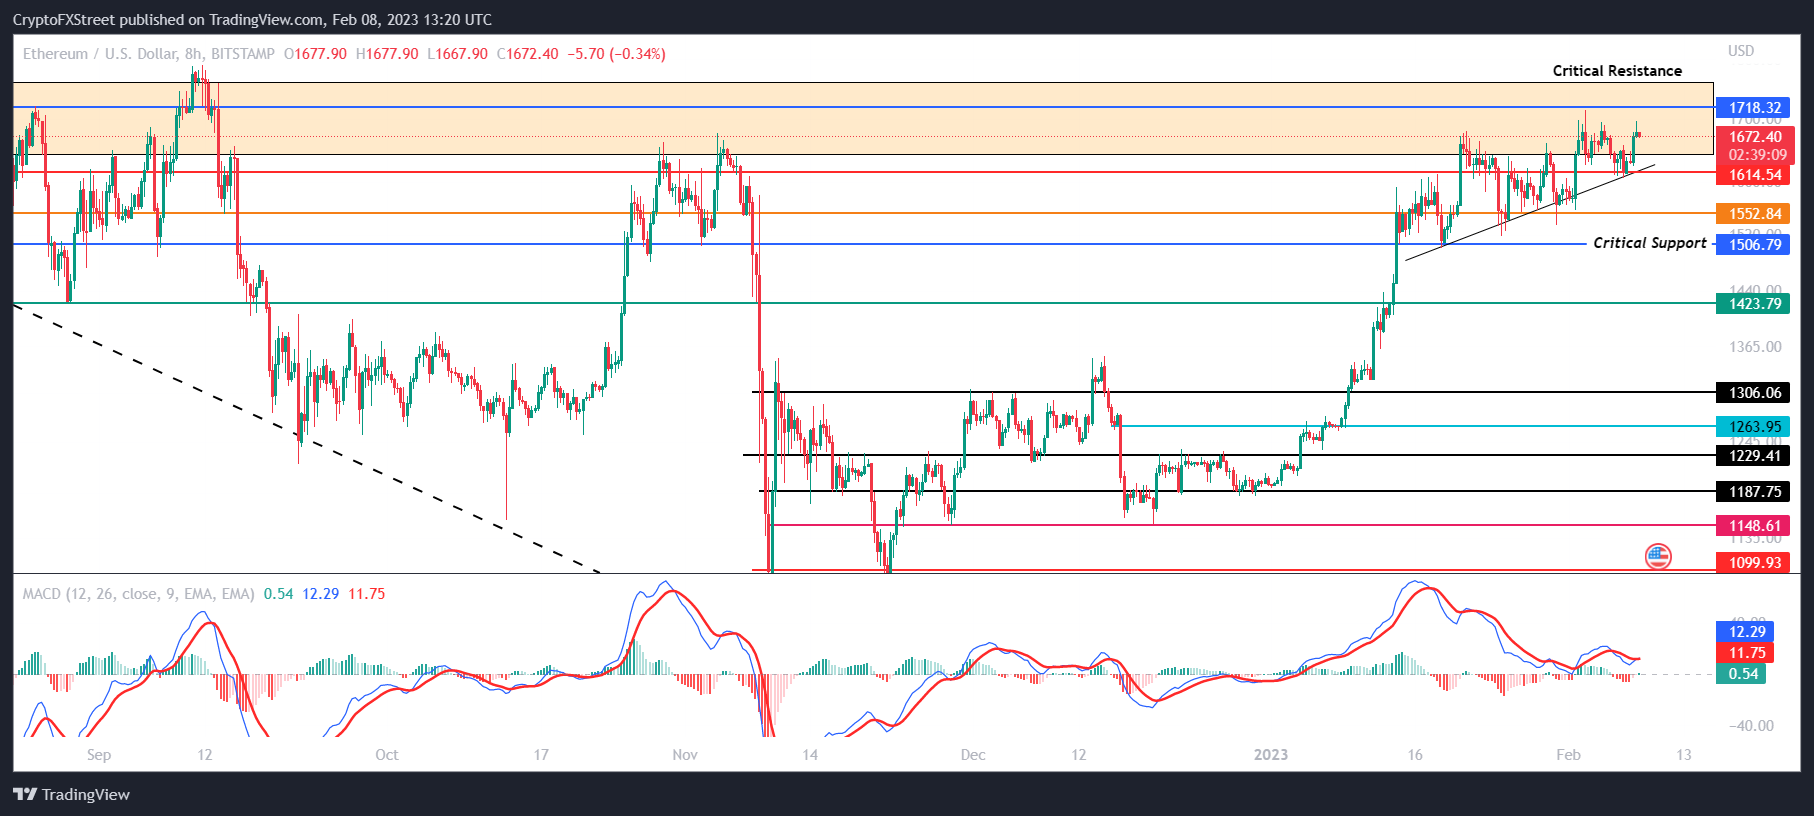
ETH/USD 8-hour chart
Ethereum price would have the opportunity to bounce back at the $1,614 and $1,552 levels, but if it fails to it will tag the critical support at $1,506. Losing this level would invalidate the almost month-long recovery for ETH pushing the price to $1,423, marking a 15% decline.
Nevertheless, if the market’s greed becomes overpowering and ETH flips $1,718 into support, the altcoin could tag the critical resistance level at $1,761. In the event that Ethereum price breaches the resistance level, the bearish thesis would be invalidated, and the cryptocurrency could tag $1,800.
Author

Aaryamann Shrivastava
FXStreet
Aaryamann Shrivastava is a Cryptocurrency journalist and market analyst with over 1,000 articles under his name. Graduated with an Honours in Journalism, he has been part of the crypto industry for more than a year now.


