How to use the Bitcoin Value Indicator

Before we get into how to use the Bitcoin Value Indicator, we need to discuss exactly what it is. If you read my last article, then you may recall that there’s an intimate relationship between the hash power of the Bitcoin network and the market cap of Bitcoin. Well, as I alluded to in that post, there are other ways of modeling the current price of Bitcoin versus the projected value of the network.
The Bitcoin Value Indicator is a report that I publish on (or near) the first of each month. The data it operates on comes from the Bitcoin network in the previous month. Most of the inputs are rolled up into monthly averages. For example, the average Bitcoin Price and the Average Hash Power of the network for the whole month.
The Bitcoin Value Indicator has three inputs, which have all been found to have very strong relationships with the market cap of Bitcoin. These three inputs are:
-
The hash rate of the network
-
The total number of transactions confirmed
-
The number of unique addresses in use
Each approach has its own strengths and weaknesses, so I do not use a single metric in isolation. Rather, I map the projections of each metric against the price independently. The output will show where the Bitcoin market cap is today in comparison to the three inputs.
There are three possible states that the market can be in, according to this model. They are the following:
-
Overbought – The Bitcoin market cap is higher than all three metrics predict.
-
Oversold – The Bitcoin market cap is lower than all three metrics predict.
-
It’s Complicated – The Bitcoin market cap is higher than at least one metric but lower than at least one other metric.
Before we dig into the output of this report, we should first talk about the inputs a bit more. I think I covered the hash power of the network fairly well in my last article, but we should talk about the other two metrics and why they might matter.
Total Transactions
I like to look at the Bitcoin blockchain to get my data, rather than from these shady crypto news sites and manipulated exchanges. So, when I talk about transactions; I’m talking about the ones that occur on the Bitcoin blockchain. These are paid transactions (even if the fee is low), which represent actual use of Bitcoin in its native format. I watch daily transactions, and the total number of transactions ever transmitted.
The daily transactions give me insight into how active the Bitcoin network is. It’s one way of thinking about Metcalfe’s law. The total number of transactions give me insight into the “age” of Bitcoin. Do you know what I mean by that?
You see, Bitcoin is marching towards its ultimate destiny, just like the rest of us. Will that path leads it into the dumpster of history, or will Bitcoin completely revolutionize how we do business and exchange value? I think those two paths are the only two viable options. But, which one is going to play out?
“Every day that goes by and Bitcoin hasn't collapsed due to legal or technical problems, that brings new information to the market. It increases the chance of Bitcoin's eventual success and justifies a higher price.” - Hal Finney, June 4th, 2011 - Bitcoin Talk Forum
Hal Finney was right. If the number of Bitcoin transactions increases; then we’re moving towards a future that includes Bitcoin front and center. If the number of transactions does not increase; then it’s plain and simple that people have stopped using Bitcoin.
The strength of comparing the Bitcoin market cap lies in the fact that the longer Bitcoin survives, the more powerful it becomes. The weakness of this approach is that excludes exchange volume, transactions that occur on sidechains (like Liquid), and it also does not account for the fledgling Lightning Network. However, at this point Liquid and Lightning only account for a tiny percentage of the value transmission over the Bitcoin network; so, I don’t think this is a big deal yet. As some point in the future, I’ll need to make an adjustment for this, however.
Total Transactions Stats
If we look at a chart of total transactions, we will see that the proper way to view this data is in log scale (sound familiar?). See below:
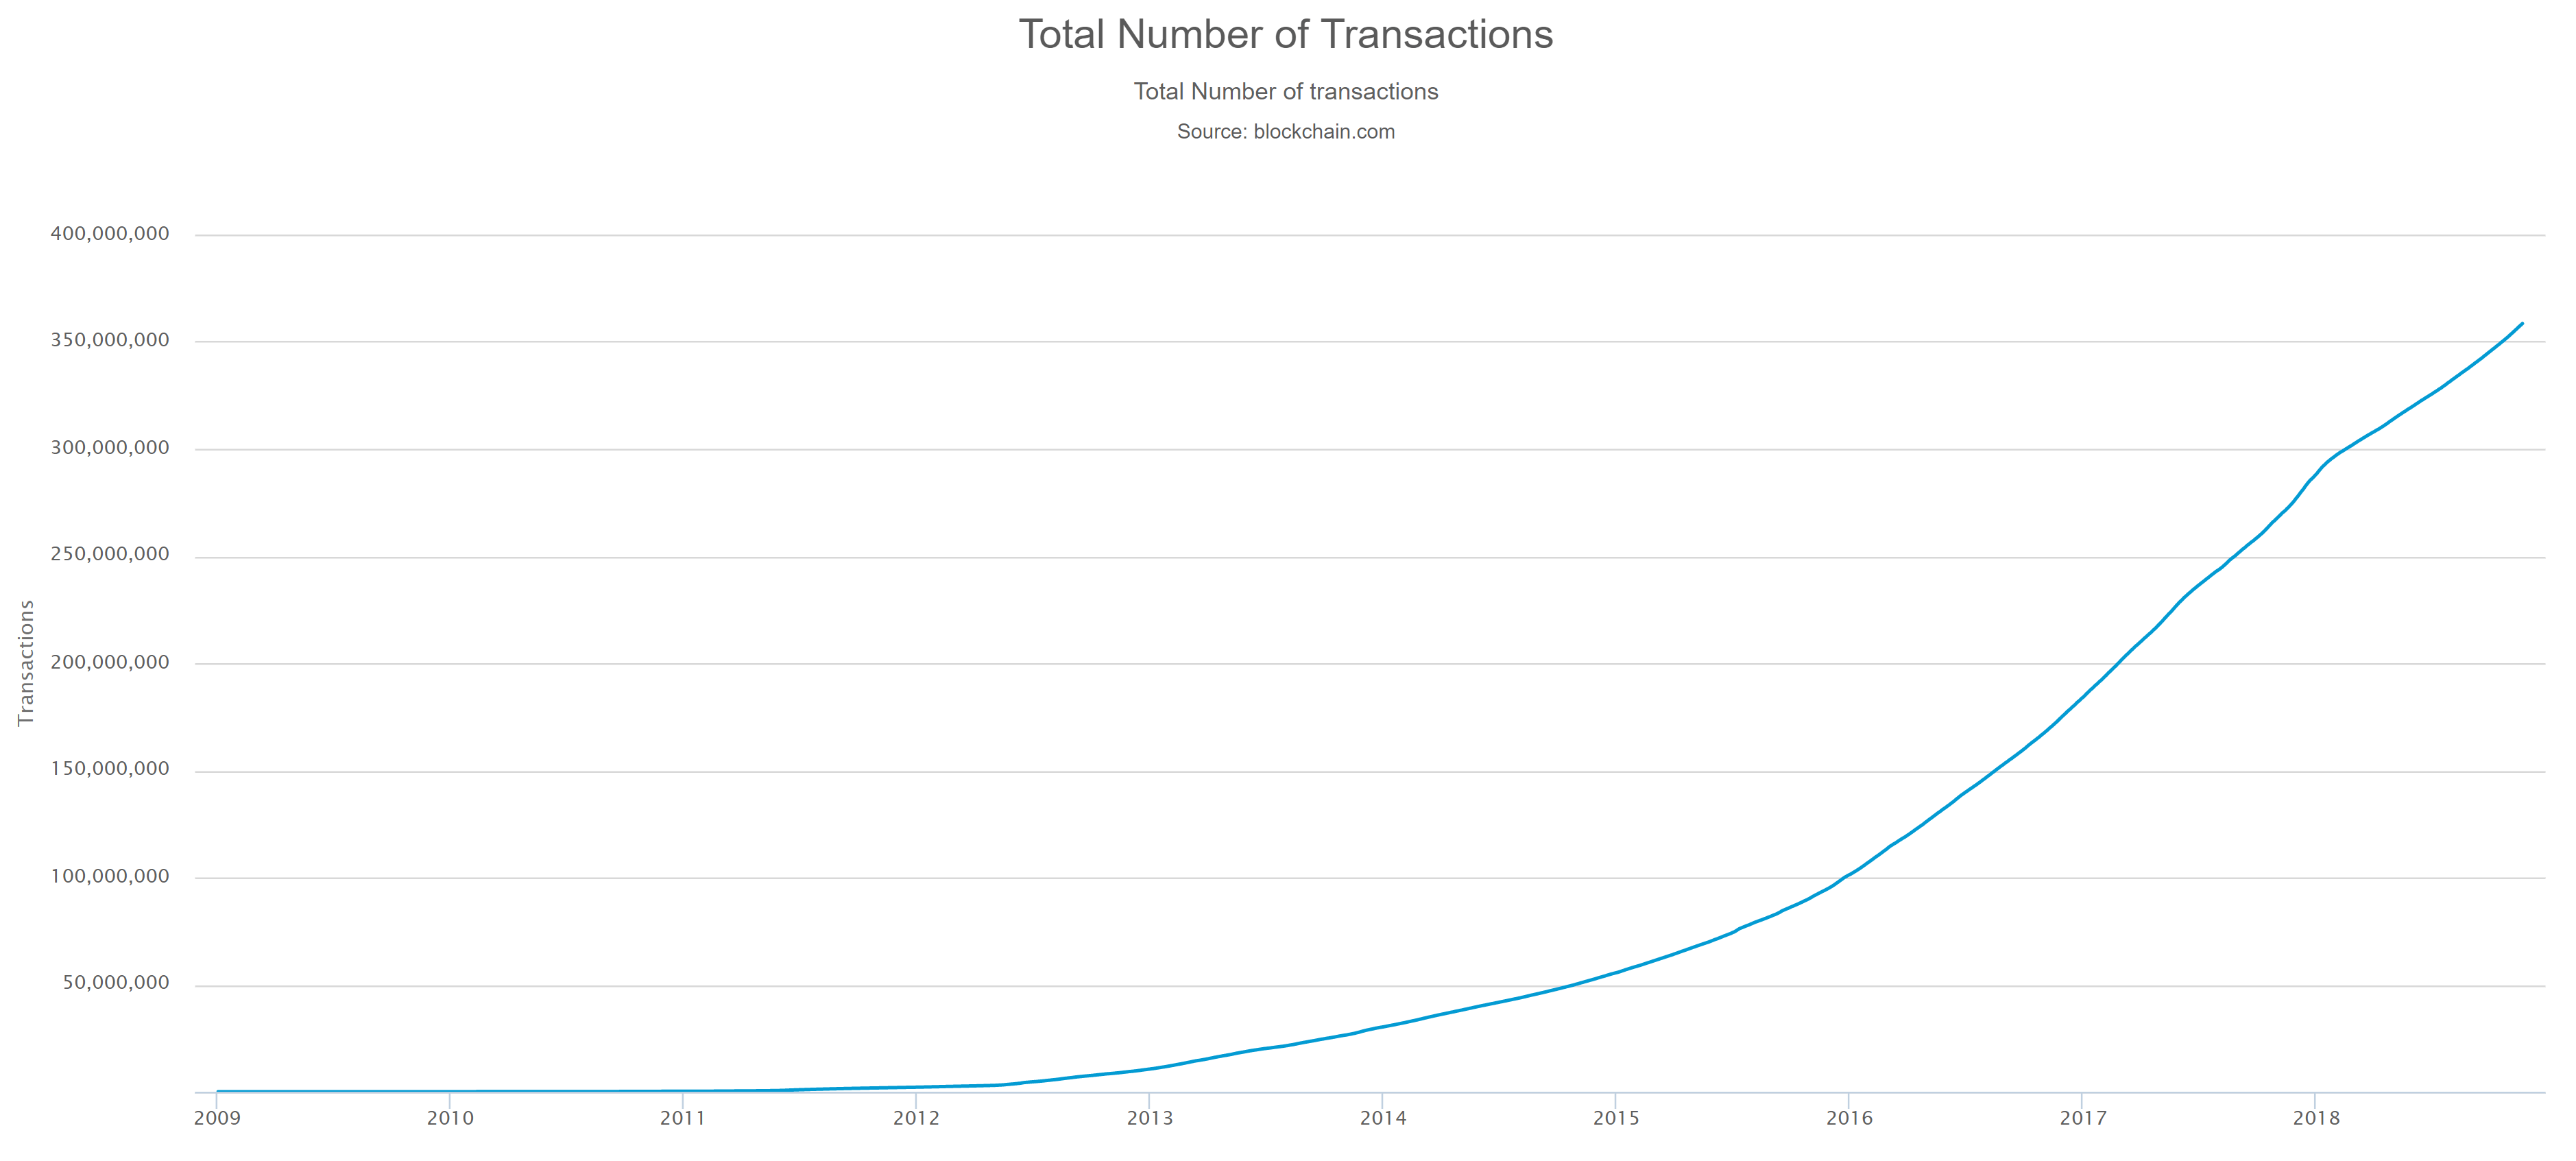
Source: blockchain.com
What you’re looking at here is the total number of Bitcoin transactions ever transmitted in Linear Scale. Looks like nothing was going on until about 2012, right?
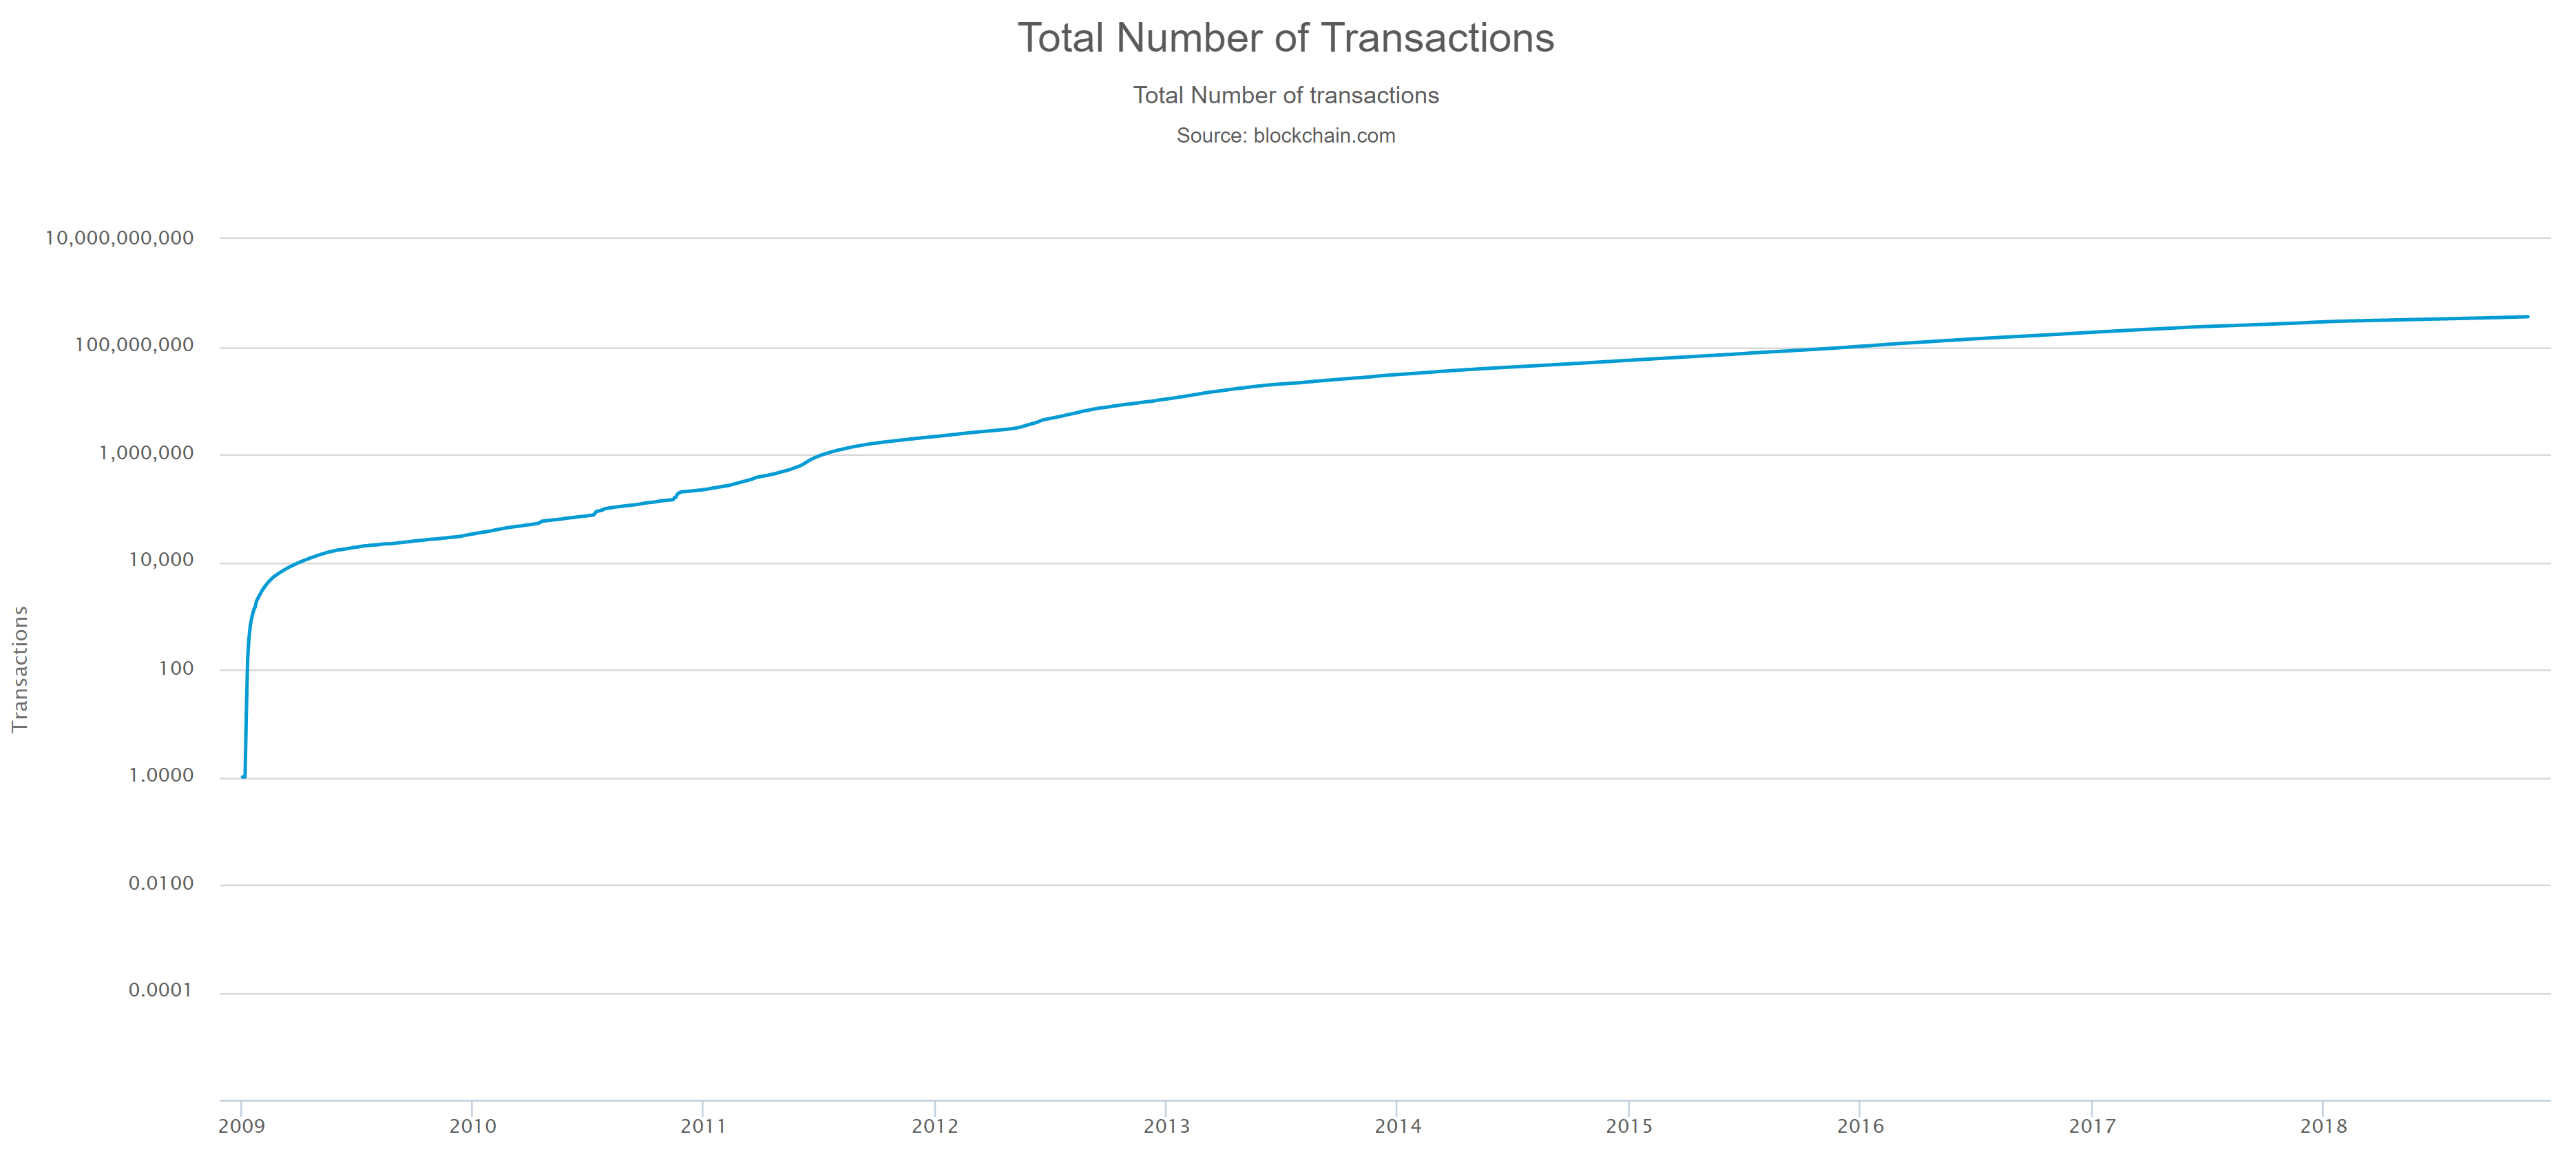
Source: blockchain.com
Wrong! The total number of transactions has been increasing exponentially since 2009, wow!
Regression Analysis – Total Transactions
Running a regression analysis on the log total transactions and the log Bitcoin market cap yields the following:
-
Correlation - 0.97037
-
R2 - 0.9416
-
Observations – 99 (it’s been 99 months since we first had a recorded price)
-
P-Value - 1.20696199067271E-61
-
T-Stat - 39.5564460531703
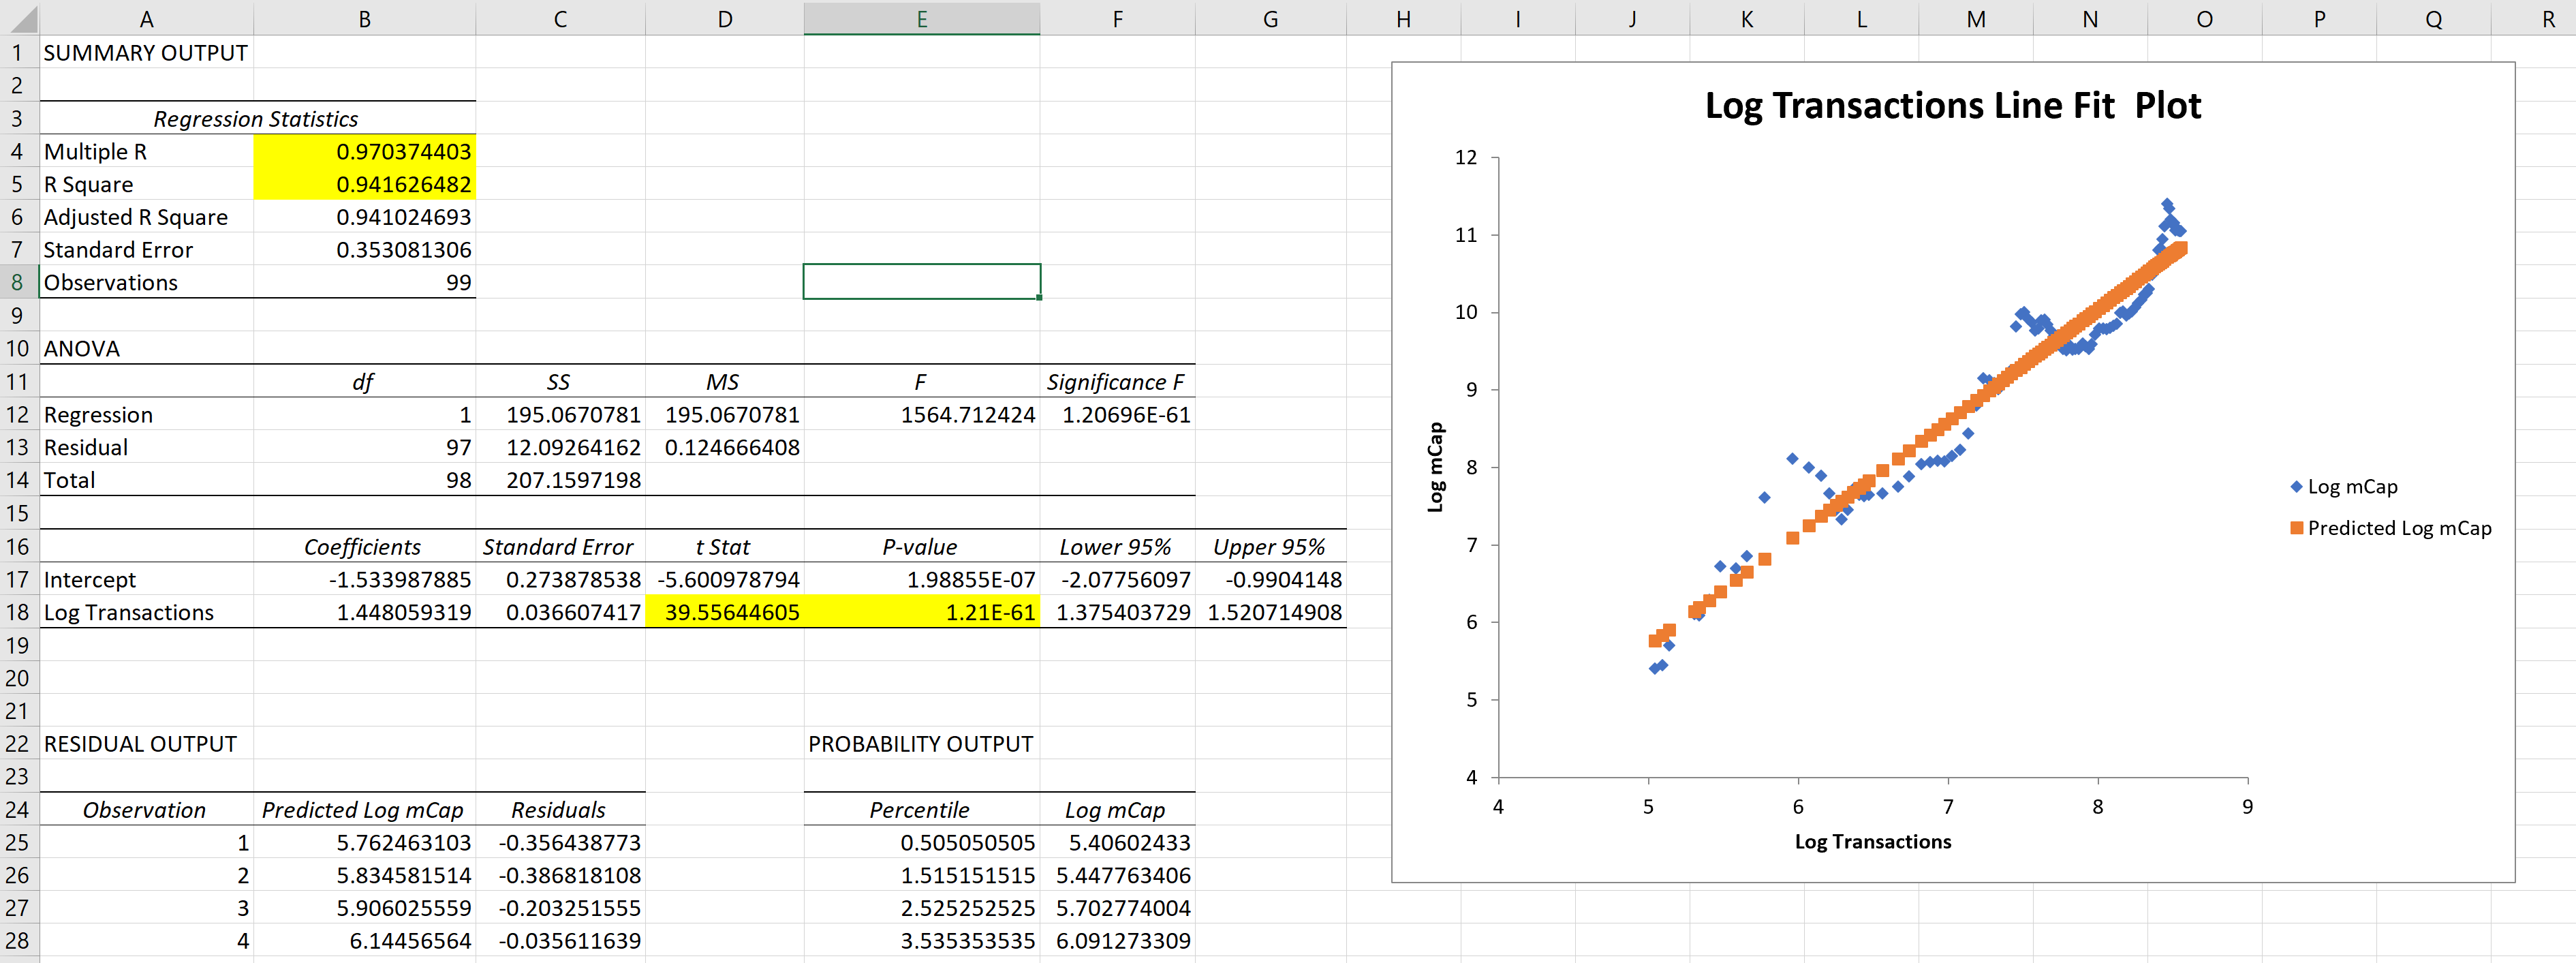
Source: blockchain.com and author’s excel
Hot diggity dog! We might be onto something here…
Unique Addresses
The number of unique addresses in use is another way to try and quantify how many Bitcoin users there are. In theory, if you control some Bitcoin, you need at least one Unique Address with some Bitcoin in it. However, if 1,000 people all use the same Bitcoin exchange, they might all be sharing a single address because the exchange is the one actually controlling the funds. So, this measurement is imperfect.
Additionally, when the Bitcoin network gets popular and more people start using it; sometimes the amount of transactions flowing through the network gets very close to the peak throughput of the system. When this happens, the fees of the network get higher, which makes the network more cumbersome to use.
We saw this last year, when the blocks filled up and the average transaction cost spiked to over $50. What a buzzkill…
Now, Bitcoin operates on something called the UTXO model, meaning that outputs are kind of like digital spare change. You might have two people, each controlling 1 BTC, but one guy has ten outputs of 0.1 BTC each, and the other guy has two outputs of 0.5 each. Functionally, they each have the ability to spent 1.0 BTC, but one wallet would need to create a larger transaction in order to spend that amount, which would equate to higher fees (the guy with ten dimes would pay a higher fee than the guy with two fifty-cent pieces if we keep with this analogy).
Why are we taking this detour to explain the UTXO model? Well, it’s because there’s another weakness in using the Unique Addresses to approximate the number of users, and it’s this. When the average transaction fee drops, people are more likely to consolidate their outputs into a single address, which will reduce the number of unique addresses in use. When the fees are high, they are less likely to do this because it’s costly to do so. Therefore, when the average fee swings up or down, it can have an overestimated impact on the number of unique addresses.
Now, that being said; I think this relationship is still worth exploring. So, let’s look at the stats.
Unique Addresses Stats
By now I expect you know that we’ll be dealing with this data in log scale, so let’s just look at that chart for a minute.
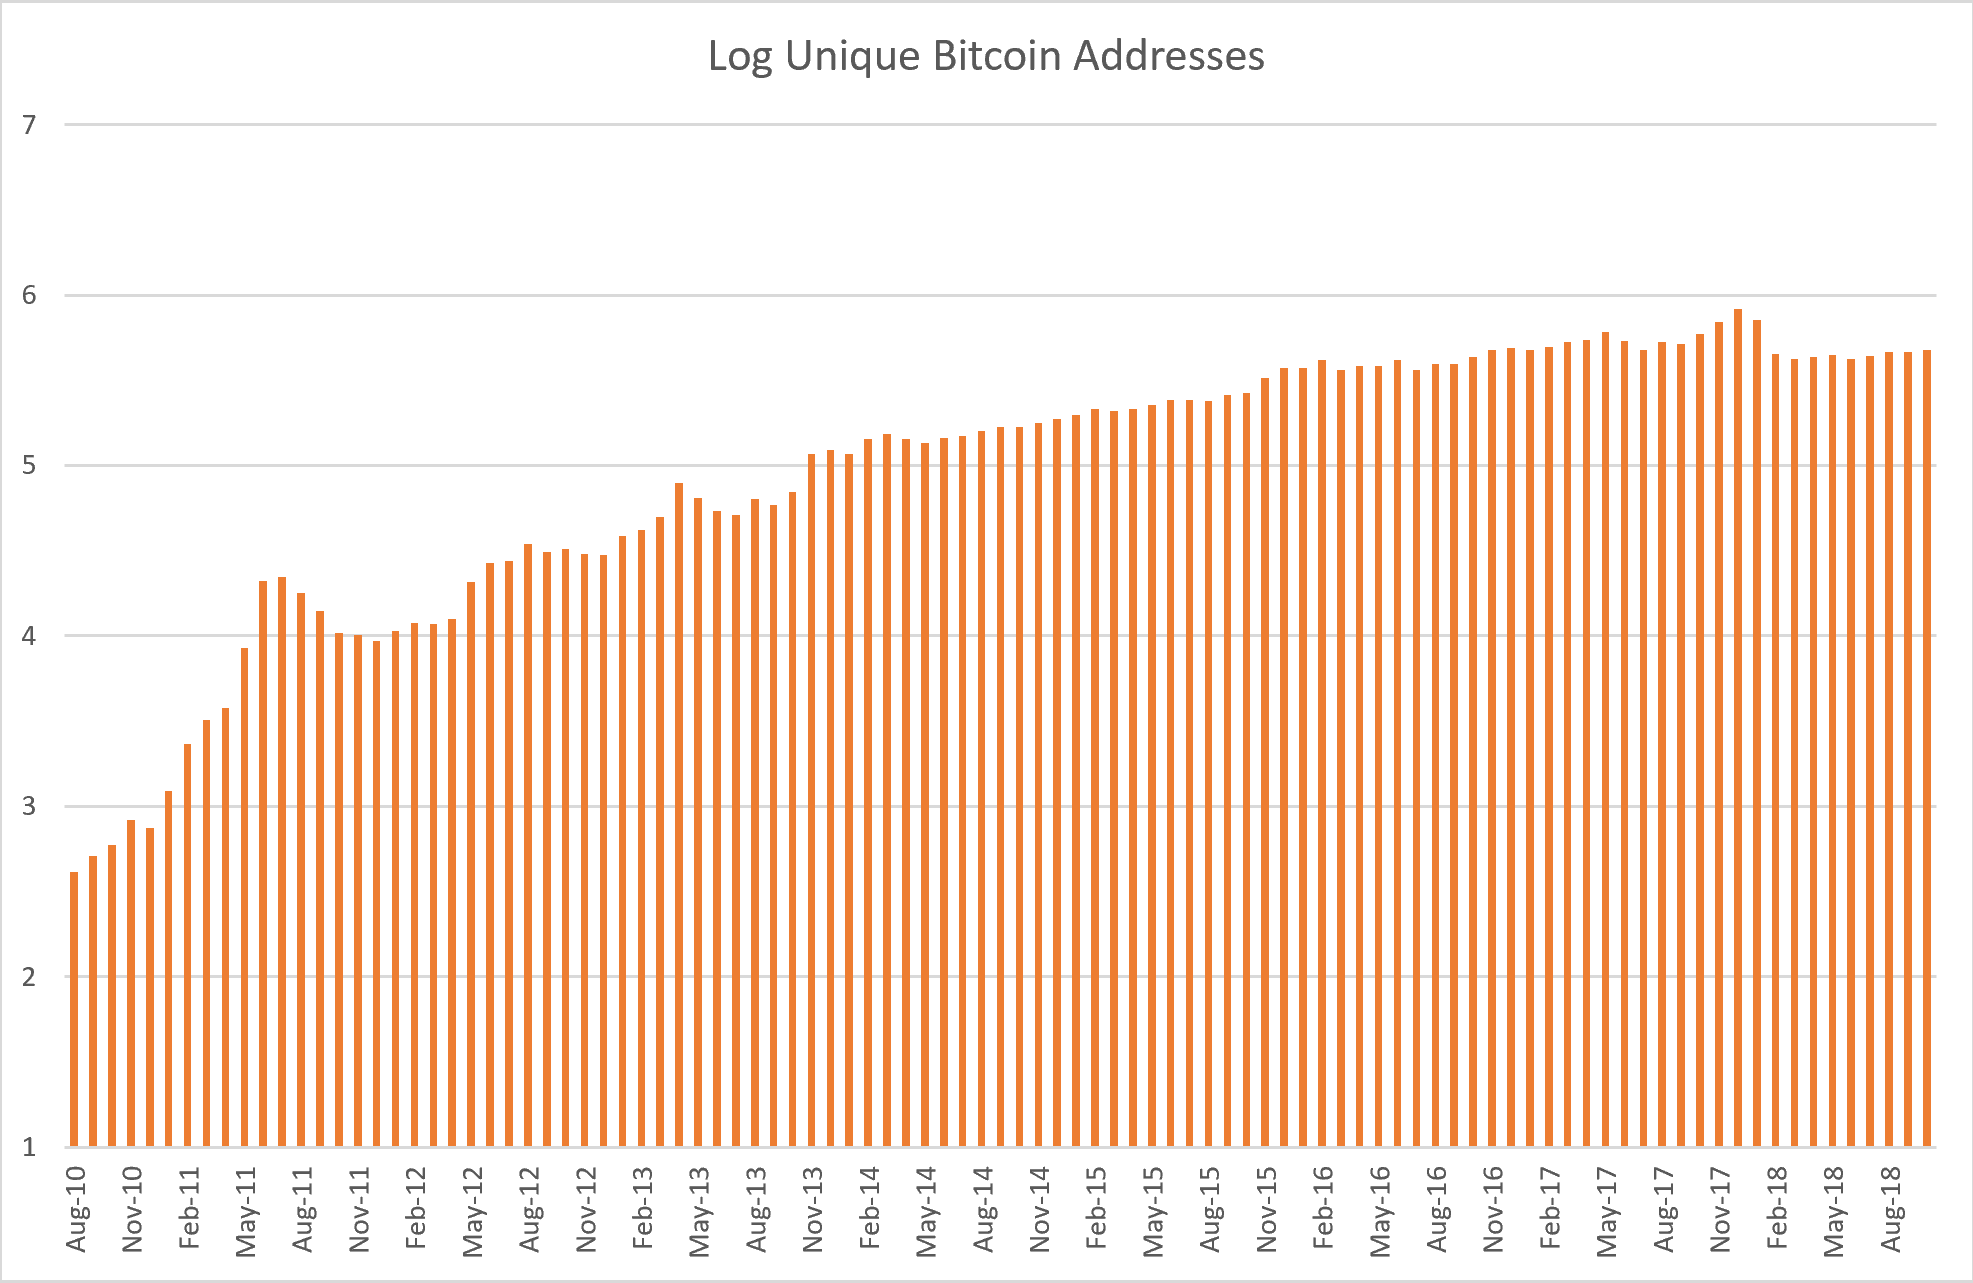
Source: blockchain.com and author’s charts
Alright, let’s run the regression.
Regression Analysis – Unique Addresses
-
Correlation - 0.9662
-
R2 - 0.9336
-
Observations – 99 (it’s been 99 months since we first had a recorded price)
-
P-Value - 5.87967442149251E-59
-
T-Stat - 36.95638264133
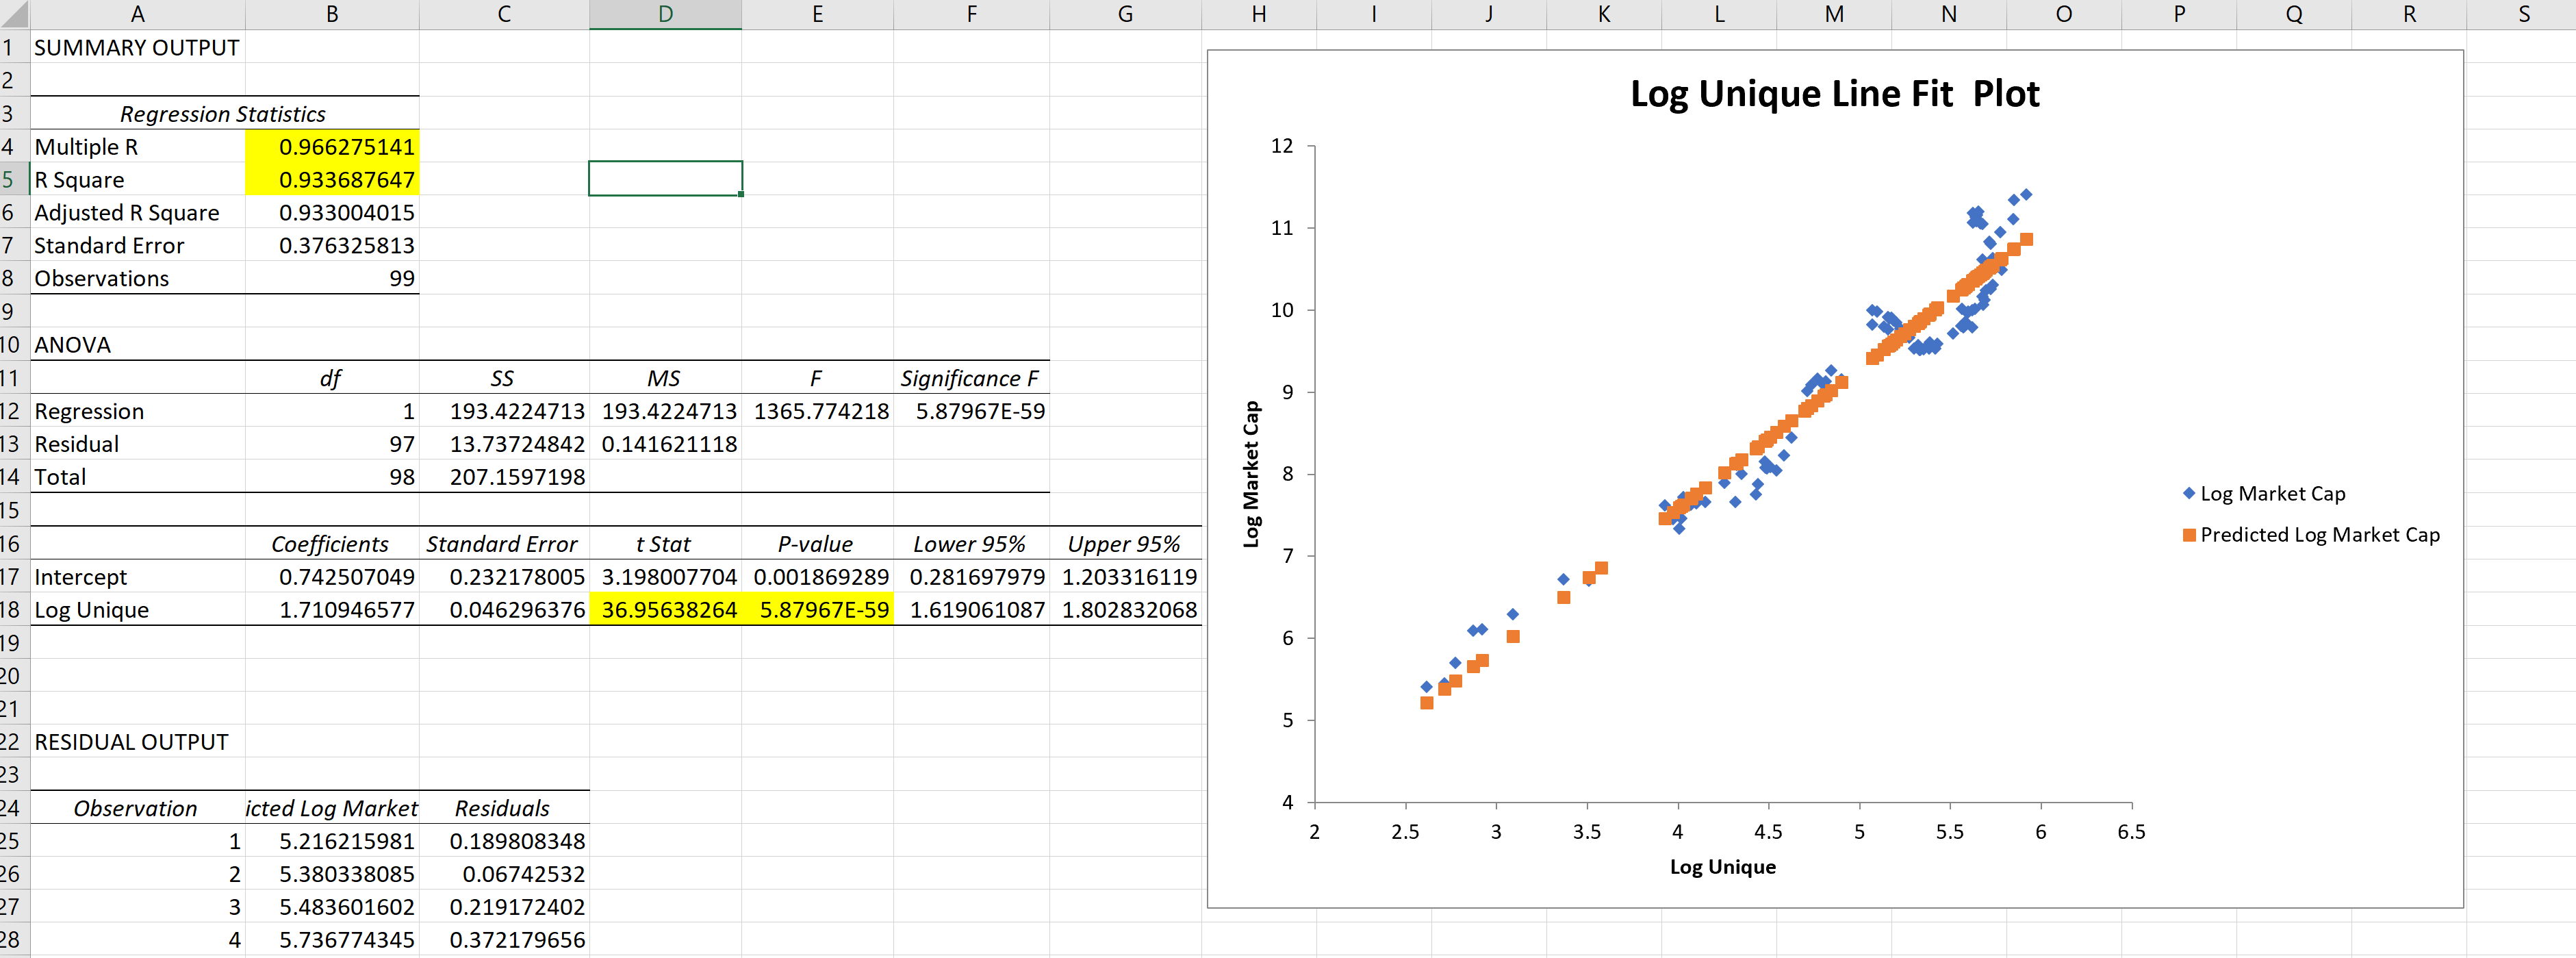
Source: blockchain.com and author’s excel
Now, lets pull this all together and look at some history.
Bitcoin Value Indicator Charts
I started publishing this report on July 1st, 2018. But before that I had been using this model for my own purposes since around January of 2018. Let’s look at the charts.

Source: blockchain.com and author’s Bitcoin Value Indicator Charts
What you are seeing here is the output of three independent variables, taken in log scale from monthly samples. The blue, orange, and grey colors represent the Unique Addresses, Hash Power, and Total Transactions respectively. The yellow line represents the market cap of the Bitcoin network. This chart is from the latest report, which was published on November 1st, 2018 and includes data up through the month of October.
As you can see, there are times when the price seems to be well below all three predictions (oversold), times when the price is above all three predictions (overbought), and then there are times when the price is above some predictions and below others (that’s when it’s complicated). According to the Bitcoin Value Indicator, the market has been overheated since June of 2017.
You will note as well, that the price movements from the last few days are not accounted for here, since November has not yet ended.
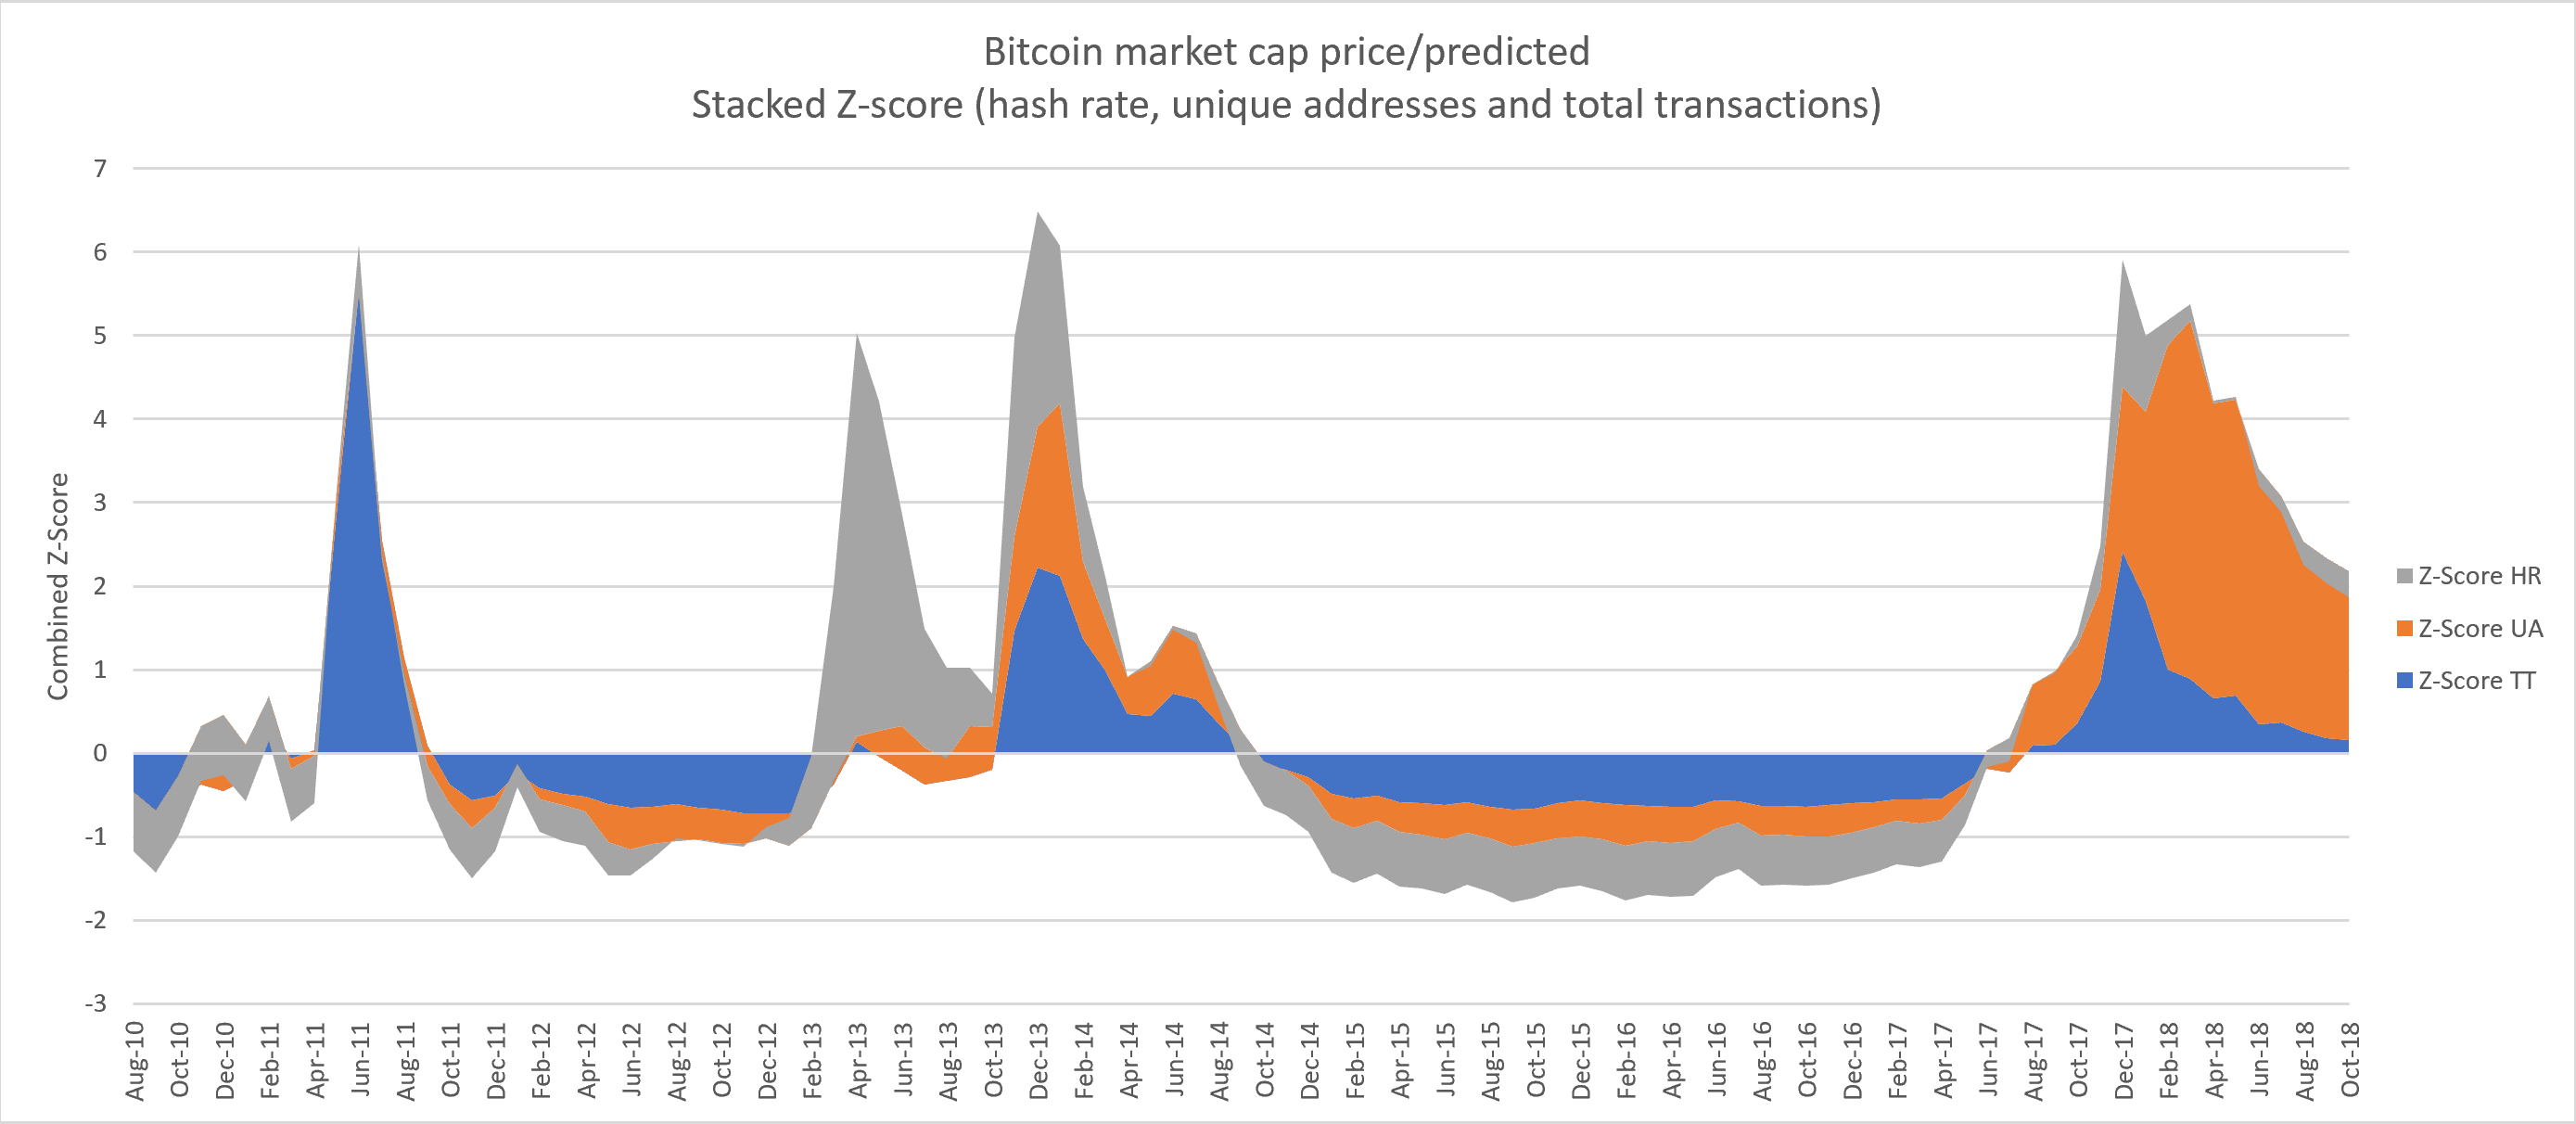
Source: blockchain.com and author’s Bitcoin Value Indicator Charts
Another fun thing you can do with this data is to put the Z-scores of price/predicted into a stacked area chart. This is what you’re seeing above. This really adds color to the peaks and valleys (literally) that we’ve seen in the market. In general, a low area represents an ideal time to enter the market, and those monstrous peaks, well… those are a good time to gracefully exit the market.
Let’s summarize this data in a table (data through October 31, 2018).

The Signal
The signal for November was “Overbought,” since the actual market cap was above all three predicted values. Interestingly, the recent market action would seem to demonstrate that these projections may not be far afield.
It is my opinion, that before we can exit this bear market; the market cap of the Bitcoin network will have to come back in line (or possibly below) these projections. That could happen in two ways:
-
The price could fall
-
The fundamentals could improve
For example, the total transactions increase more quickly when there’s more transactions taking place; and more slowly when there are fewer, correct? Well, since the bubble burst earlier this year, the number of transactions per month fell at first; but then it stabilized and has been growing again since March.
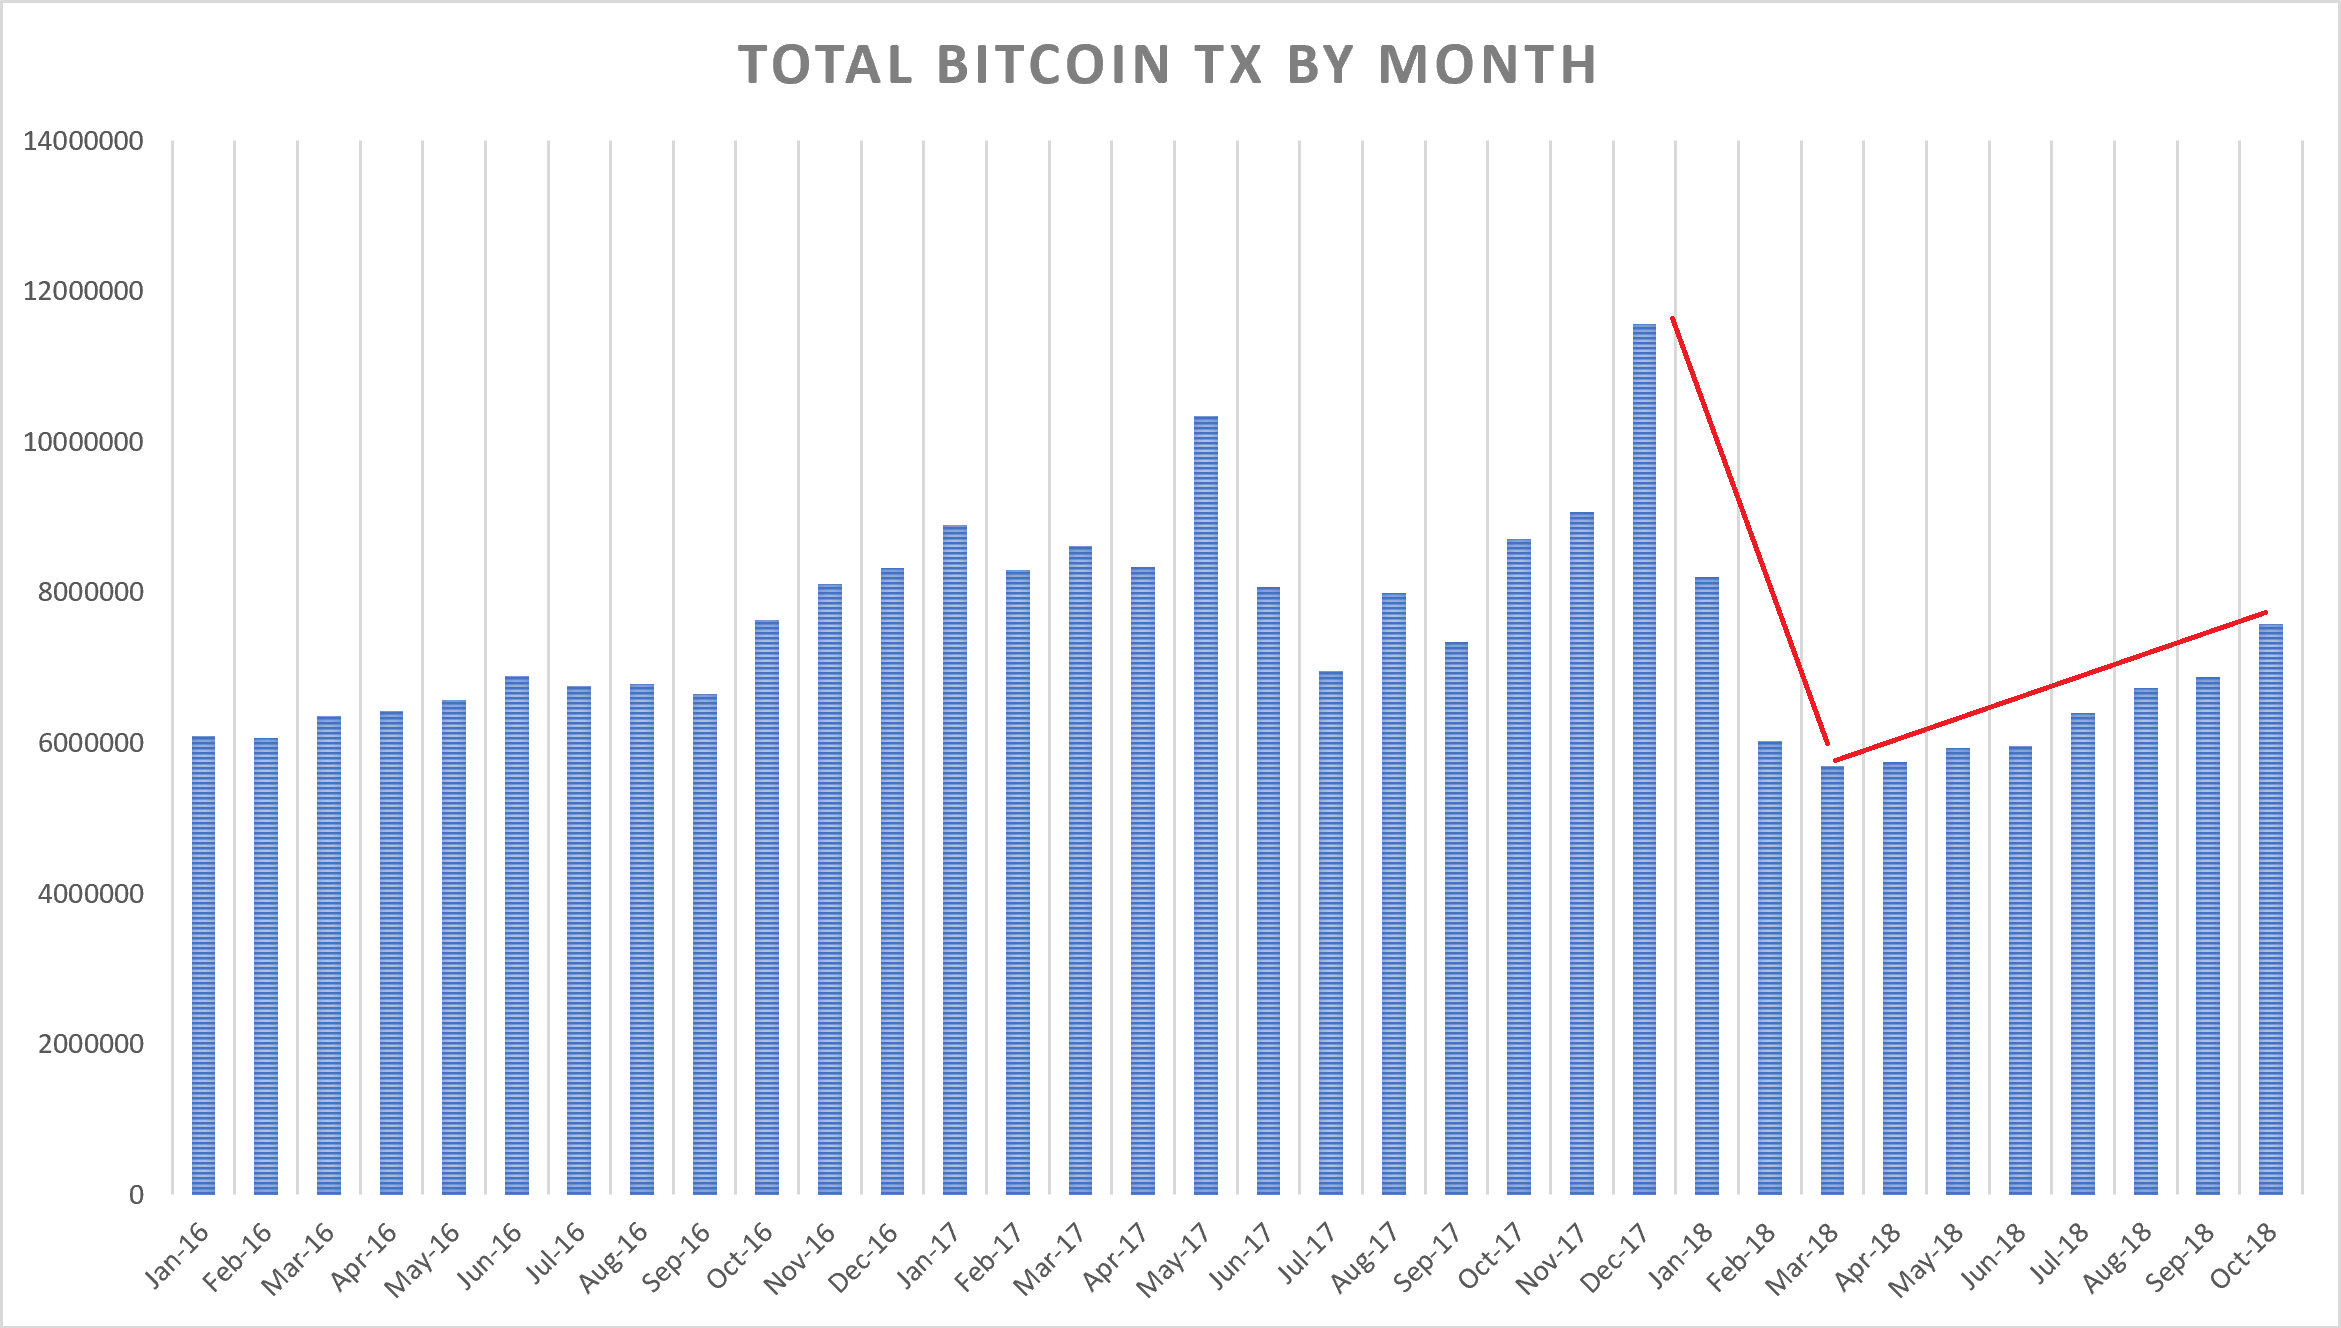
Source: blockchain.com and author’s charts
It’s the same thing with the number of unique addresses. If this statistic does not continue to improve, it would seem to suggest that the bottom is nowhere near close to being in yet. However, the number of unique addresses is growing. So, I believe we will see an improvement in this projection in the coming months if this continues to grow as it has been lately.

Source: blockchain.com
Conclusion
If you like the Bitcoin Value Indicator report, you can find all of them going back to July over on Seeking Alpha. I post a new one each month, along with commentary and research into other crypto assets as well. If you found this article useful, reach out and let me know.
Author

Hans Hauge
Independent Analyst
A cryptocurrency entrepreneur, author and analyst; currently the opinion leader on cryptocurrency on Seeking Alpha.


