- Shiba Inu price is traversing a bullish pennant, indicating a continuation of an uptrend.
- Investors can expect a 34% upswing to $0.0000154 if the intermediate hurdles are cleared.
- A daily candlestick close below the $0.0000095 support level will invalidate the bullish thesis for SHIB.
Shiba Inu price shows a breakout from a bullish setup, signaling an affinity to climb higher. Moreover, SHIB is in the perfect position to capitalize on the next leg that is likely to result in an explosive move.
Shiba Inu price is ready to rumble
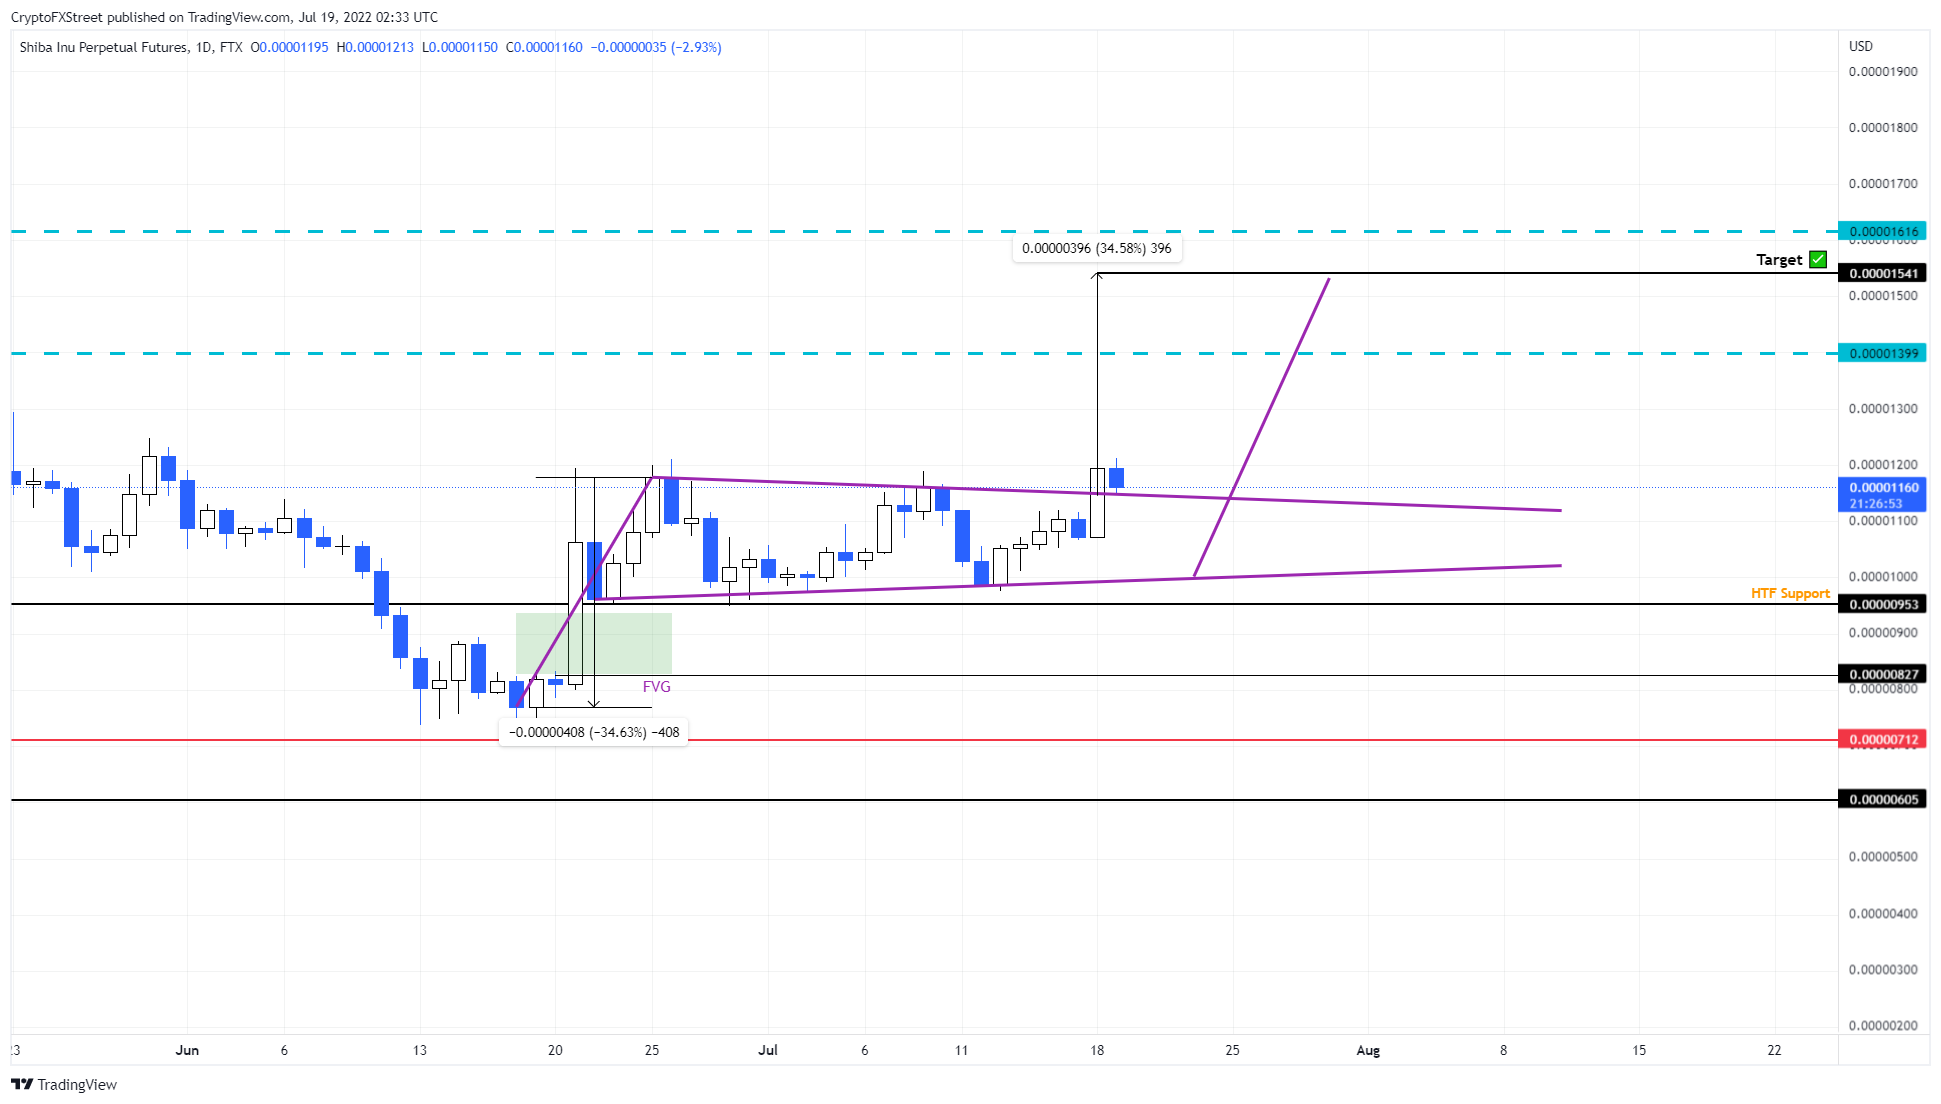
Shiba Inu price is traversing a continuation pattern known as a bullish pennant. This technical formation contains a flagpole and a pennant.
The 34% explosive move SHIB witnessed between June 19 and June 25 formed the flagpole and the consolidation in the form of higher lows and lower highs form a pennant. This technical formation forecasts a 34% upswing to $0.0000154, obtained by adding the flagpole height to the breakout point at $0.0000116.
Interestingly, Shiba Inu price pierced through the pennant’s upper trend line and produced a daily candlestick close above it at roughly $0.0000116, signaling a breakout. Therefore, this bullish signal is validated, but investors should wait for a secondary confirmation that will arrive after SHIB successfully retests the pennant as throwback support.
If this retest holds, investors can expect Shiba Inu price to reach its target at $0.0000154, especially after overcoming the intermediate hurdle at $0.0000139.
SHIB/USDT 4-hour chart
While things look straightforward for Shiba Inu price, a re-entry into the pennant will indicate weak buying pressure. In such a case, if SHIB produces a daily candlestick close below the $0.0000095 support level, it will invalidate the bullish thesis for SHIB.
This development could further see Shiba Inu price revisit the $0.0000082 barrier.
Information on these pages contains forward-looking statements that involve risks and uncertainties. Markets and instruments profiled on this page are for informational purposes only and should not in any way come across as a recommendation to buy or sell in these assets. You should do your own thorough research before making any investment decisions. FXStreet does not in any way guarantee that this information is free from mistakes, errors, or material misstatements. It also does not guarantee that this information is of a timely nature. Investing in Open Markets involves a great deal of risk, including the loss of all or a portion of your investment, as well as emotional distress. All risks, losses and costs associated with investing, including total loss of principal, are your responsibility. The views and opinions expressed in this article are those of the authors and do not necessarily reflect the official policy or position of FXStreet nor its advertisers. The author will not be held responsible for information that is found at the end of links posted on this page.
If not otherwise explicitly mentioned in the body of the article, at the time of writing, the author has no position in any stock mentioned in this article and no business relationship with any company mentioned. The author has not received compensation for writing this article, other than from FXStreet.
FXStreet and the author do not provide personalized recommendations. The author makes no representations as to the accuracy, completeness, or suitability of this information. FXStreet and the author will not be liable for any errors, omissions or any losses, injuries or damages arising from this information and its display or use. Errors and omissions excepted.
The author and FXStreet are not registered investment advisors and nothing in this article is intended to be investment advice.
Recommended Content
Editors’ Picks

Bitcoin holds $84,000 despite Fed’s hawkish remarks and spot ETFs outflows
Bitcoin is stabilizing around $84,000 at the time of writing on Thursday after facing multiple rejections around the 200-day EMA at $85,000 since Saturday. Despite risk-off sentiment due to the hawkish remarks by the US Fed on Wednesday, BTC remains relatively stable.

Crypto market cap fell more than 18% in Q1, wiping out $633.5 billion after Trump’s inauguration top
CoinGecko’s Q1 Crypto Industry Report highlights that the total crypto market capitalization fell by 18.6% in the first quarter, wiping out $633.5 billion after topping on January 18, just a couple of days ahead of US President Donald Trump’s inauguration.

Top meme coin gainers FARTCOIN, AIDOGE, and MEW as Trump coins litmus test US SEC ethics
Cryptocurrencies have been moving in lockstep since Monday, largely reflecting sentiment across global markets as United States (US) President Donald Trump's tariffs and trade wars take on new shapes and forms each passing day.

XRP buoyant above $2 as court grants Ripple breathing space in SEC lawsuit
A US appellate court temporarily paused the SEC-Ripple case for 60 days, holding the appeal in abeyance. The SEC is expected to file a status report by June 15, signaling a potential end to the four-year legal battle.
Bitcoin Weekly Forecast: Market uncertainty lingers, Trump’s 90-day tariff pause sparks modest recovery
Bitcoin (BTC) price extends recovery to around $82,500 on Friday after dumping to a new year-to-date low of $74,508 to start the week. Market uncertainty remains high, leading to a massive shakeout, with total liquidations hitting $2.18 billion across crypto markets.

The Best brokers to trade EUR/USD
SPONSORED Discover the top brokers for trading EUR/USD in 2025. Our list features brokers with competitive spreads, fast execution, and powerful platforms. Whether you're a beginner or an expert, find the right partner to navigate the dynamic Forex market.