How to scalp Polkadot price for 15% profits
- Polkadot price shows signs of coiling up which could result in a breakout higher.
- The bullish divergence sells the potential narrative and could propel DOT by 15% to $16.44.
- A daily candlestick close below $14.04 will invalidate the bullish thesis.

Polkadot price is trading between two barriers. The recent downswing, however, actually provides a good opportunity to position long for the upcoming move.
Polkadot price readies for a higher high
Polkadot price crashed 14% between April 30 and May 1 and set a range low at $14.15. This move was handled well by buyers, who started accumulating at the low. As a result, DOT rallied 16% and created equal highs at $16.44.
After this top reversal pattern, Polkadot price crashed 14% again to sweep the range low at $14.15 again, thus starting to form a range. In a range bound setting, the asset sweeps one side of the range to collect liquidity and trigger an explosive move to do the same on the other side.
Investors can expect DOT to show a buying activity around the current level, at the range floor. Adding credence to this bullish outlook is the bullish convergence of Polkadot price, which is showing a lower low against the Relative Strength Index’s (RSI) higher low. This indicates the bearish price action lacks underlying strength and hints at the possibility of a reversal on the horizon.
To conclude, these two technicals – the formation of the range and the bullish RSI – suggest an upswing for DOT is a likely outcome.
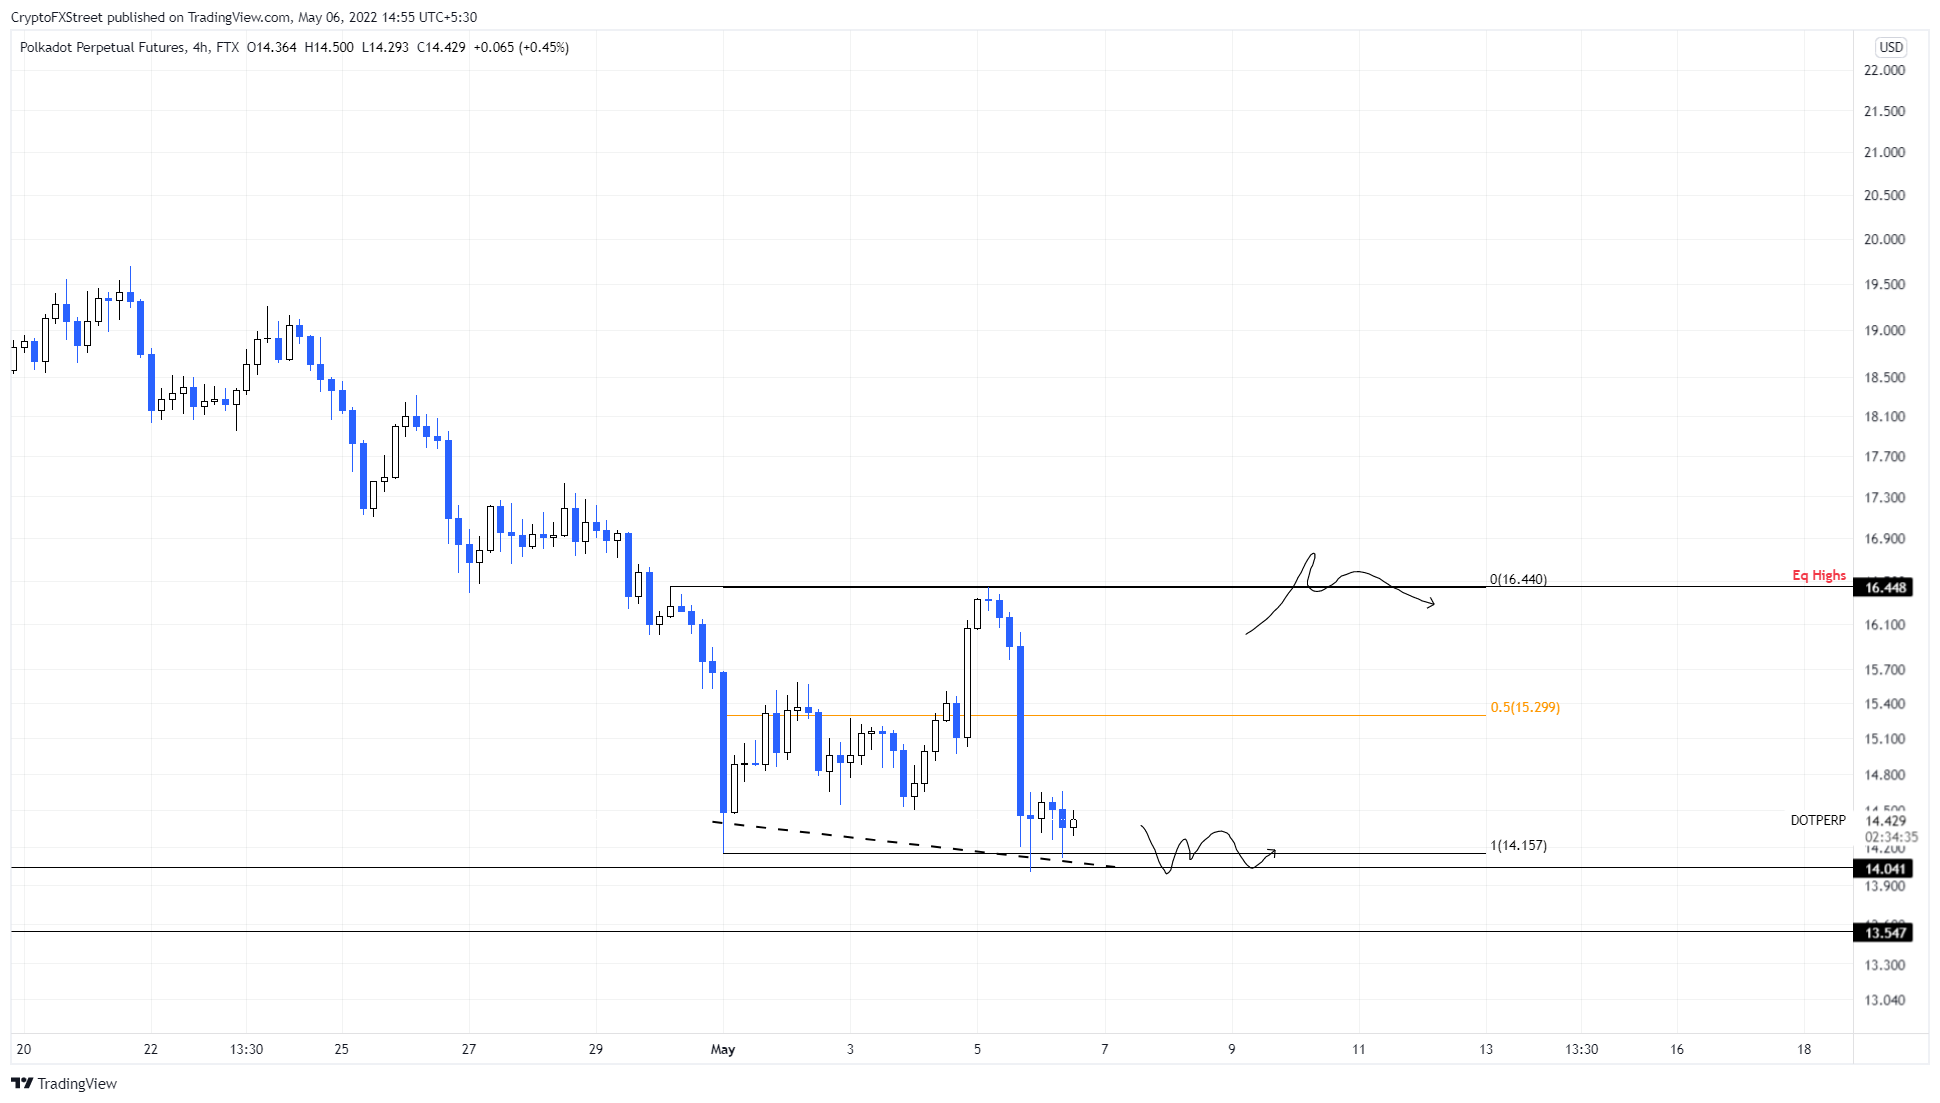
DOT/USDT 4-hour chart
While things are looking up for Polkadot price, the optimism is heavily dependent on the way Bitcoin price resolves itself after the recent crash.
A daily candlestick close below $14.04, for example, will invalidate the bullish thesis for Polkadot price by producing a lower low. In such a case, DOT could slide 3% to the next line of defense - $13.54.
Author

Akash Girimath
FXStreet
Akash Girimath is a Mechanical Engineer interested in the chaos of the financial markets. Trying to make sense of this convoluted yet fascinating space, he switched his engineering job to become a crypto reporter and analyst.


