- Cardano price slowly struts higher to complete the inverse head-and-shoulder pattern.
- From the current position, ADA provides an opportunity to capitalize on an 80% move.
- A daily candlestick close below $0.85 will invalidate the bullish thesis.
Cardano price is forming a bottom reversal pattern that could pull it from the multi-month downtrend and kick-start a bull rally. However, ADA bulls have their own set of hurdles to overcome for such a bullish outcome.
Cardano price heads toward a bullish future
Cardano price action since January 21 seems to be hinting at the formation of an inverse head-and-shoulder pattern. The technical formation contains three distinctive valleys. The one in the middle is typically deeper than the other two and forms the “head.” The slightly lower valleys on either side of almost equal height, create the “shoulders.” Hence the namesake “head-and-shoulders.”
Connecting the peaks of these valleys using a trend line reveals a resistance barrier known as the “neckline” at $1.26.
Investors should note that a decisive close above $1.26 will signal a breakout. However, the said pattern is not complete unless ADA retests the neckline. Therefore, a reversal in trend could snuff out the possibility of an upswing.
Regardless, if Cardano price continues to head higher, the head-and-shoulders pattern will be confirmed. A daily candlestick close above $1.26 will confirm a breakout. In such a case, the $1.70 target is determined by measuring the 36% distance between the head’s lowest point to the neckline, and adding that to the breakout point.
However, the run-up will not be a cakewalk as ADA will also face massive headwinds around the 2022 volume point of control at $1.05. The point on control is a place where ADA volume traded in 2022 was the highest. Overcoming this blockade will be the first test of the bulls’ strength. Clearing this ceiling will allow ADA to push through the $1.22 to $1.35 hurdle and make a run at the forecasted target at $1.70, bringing the total gain to 83%.
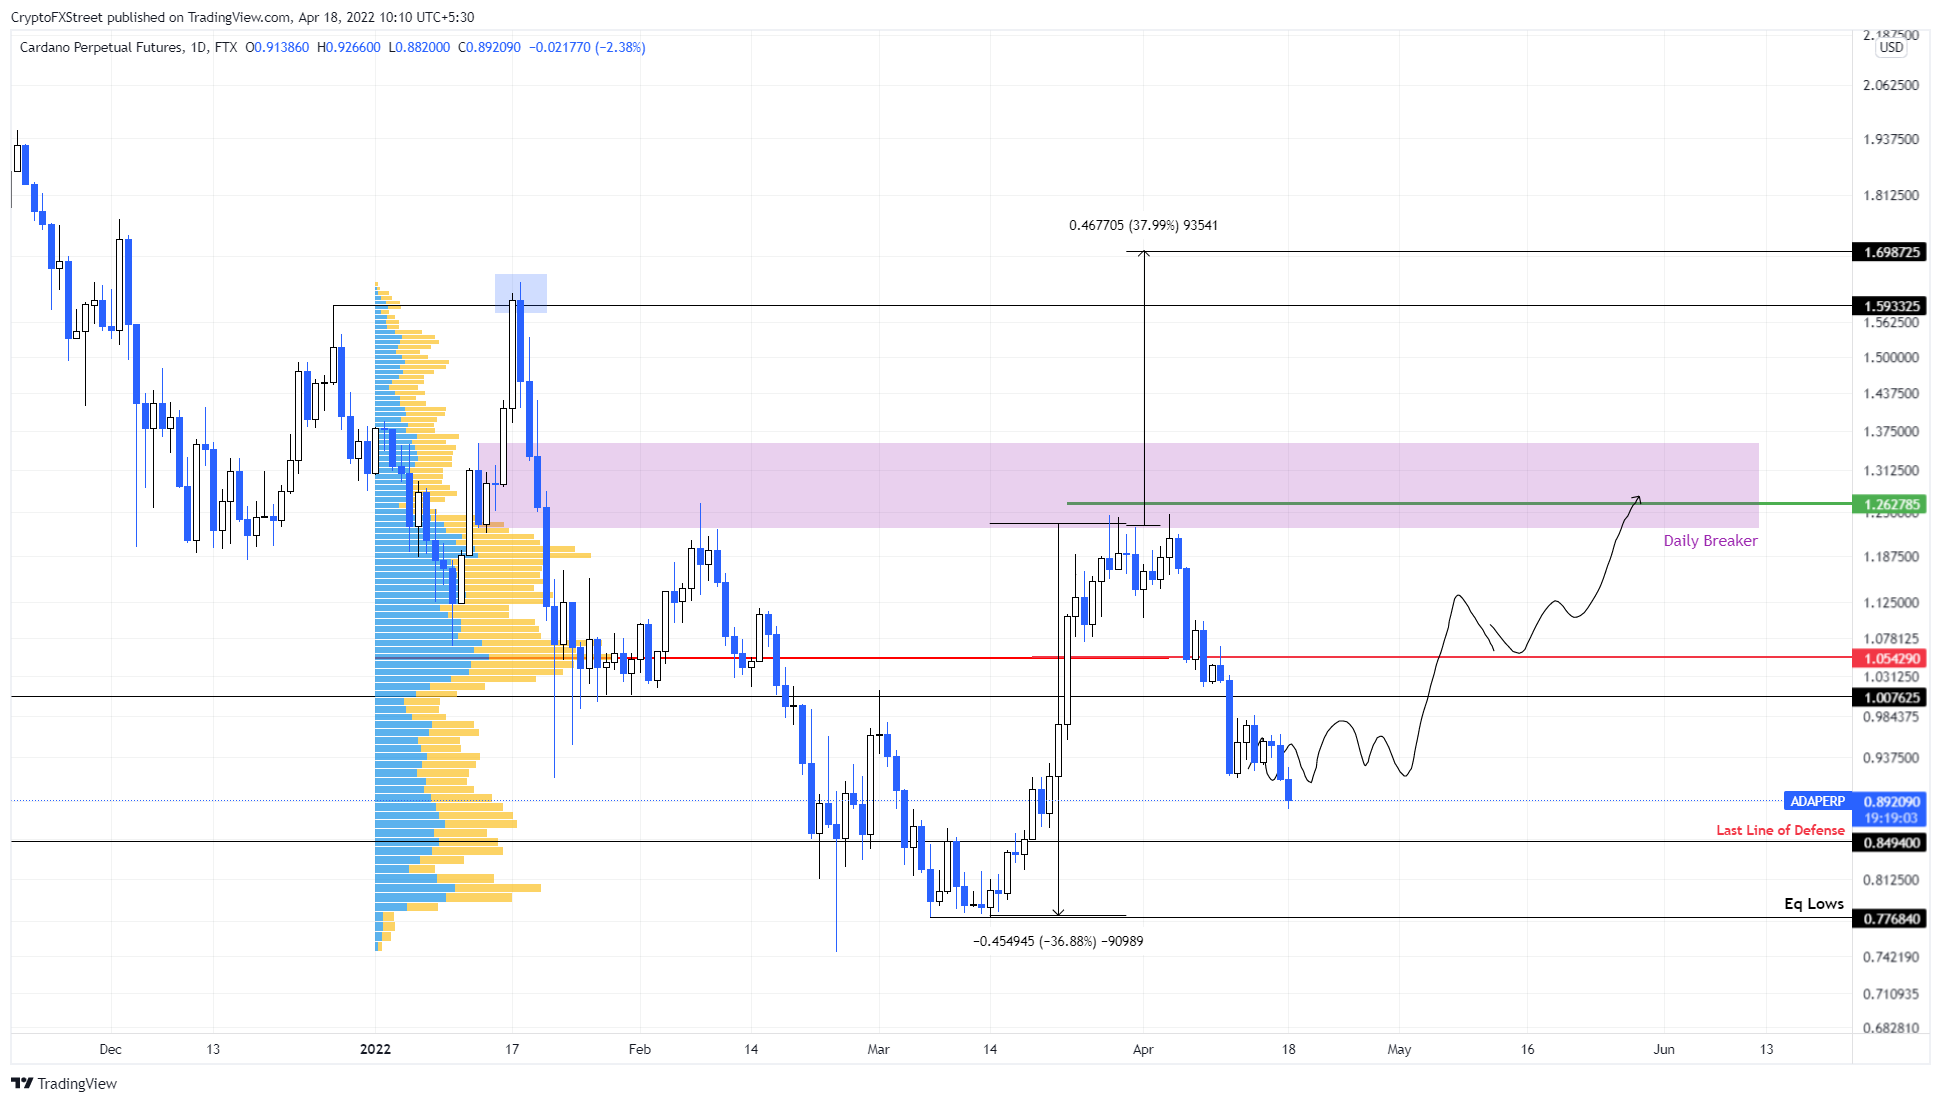
ADA/USDT 1-day chart
Supporting this massive upswing position for Cardano price is the 365-day Market Value to Realized Value (MVRV) model. This on-chain metric is used to determine the average profit/loss of investors that purchased ADA over the past year.
A value below -10% indicates that short-term holders are at a loss and are less likely to sell, which is where long-term holders tend to accumulate. Hence, any move below -10% is termed an “opportunity zone.”
For ADA, the 365-day MVRV has stayed in the negative territory since December 1, 2021, indicating the massive oversold condition of the altcoin. Therefore, investors can expect long-term holders to be accumulating.
In such a case, the inverse head-and-shoulders pattern could be the metaphorical valve that kick-starts a massive move to the upside.
 [08.17.52, 18 Apr, 2022]-637858537392114238.png)
ADA 365-day MVRV
On the other hand, a headwind that pushes Cardano price to reverse the trend will put the potential gains in jeopardy. A daily candlestick close below $0.85 will invalidate the bullish thesis by producing a lower low.
In such a case, ADA could crash to $0.77 before stabilizing and rethinking the directional bias.
Information on these pages contains forward-looking statements that involve risks and uncertainties. Markets and instruments profiled on this page are for informational purposes only and should not in any way come across as a recommendation to buy or sell in these assets. You should do your own thorough research before making any investment decisions. FXStreet does not in any way guarantee that this information is free from mistakes, errors, or material misstatements. It also does not guarantee that this information is of a timely nature. Investing in Open Markets involves a great deal of risk, including the loss of all or a portion of your investment, as well as emotional distress. All risks, losses and costs associated with investing, including total loss of principal, are your responsibility. The views and opinions expressed in this article are those of the authors and do not necessarily reflect the official policy or position of FXStreet nor its advertisers. The author will not be held responsible for information that is found at the end of links posted on this page.
If not otherwise explicitly mentioned in the body of the article, at the time of writing, the author has no position in any stock mentioned in this article and no business relationship with any company mentioned. The author has not received compensation for writing this article, other than from FXStreet.
FXStreet and the author do not provide personalized recommendations. The author makes no representations as to the accuracy, completeness, or suitability of this information. FXStreet and the author will not be liable for any errors, omissions or any losses, injuries or damages arising from this information and its display or use. Errors and omissions excepted.
The author and FXStreet are not registered investment advisors and nothing in this article is intended to be investment advice.
Recommended Content
Editors’ Picks

Polygon joins forces with WSPN to expand stablecoin adoption
WSPN, a stablecoin infrastructure company based in Singapore, has teamed up with Polygon Labs to make its stablecoin, WUSD, more useful in payment and decentralized finance.

Coinbase envisages listing of more meme coins amid regulatory optimism
Donald Trump's expected return to the White House creates excitement in the cryptocurrency sector, especially at Coinbase, the largest US-based crypto exchange. The platform is optimistic that the new administration will focus on regulatory clarity, which could lead to more token listings, including popular meme coins.

Cardano's ADA leaps to 2.5-year high of 90 cents as whale holdings exceed $12B
As Bitcoin (BTC) gets closer to the $100,000 mark for the first time — it crossed $99,000 earlier Friday — capital is rotating into alternative cryptocurrencies, creating a buzz in the broader crypto market.
Shiba Inu holders withdraw 1.67 trillion SHIB tokens from exchange
Shiba Inu trades slightly higher, around $0.000024, on Thursday after declining more than 5% the previous week. SHIB’s on-chain metrics project a bullish outlook as holders accumulate recent dips, and dormant wallets are on the move, all pointing to a recovery in the cards.

Bitcoin: Rally expected to continue as BTC nears $100K
Bitcoin (BTC) reached a new all-time high of $99,419, just inches away from the $100K milestone and has rallied over 9% so far this week. This bullish momentum was supported by the rising Bitcoin spot Exchange Traded Funds (ETF), which accounted for over $2.8 billion inflow until Thursday. BlackRock and Grayscale’s recent launch of the Bitcoin ETF options also fueled the rally this week.

Best Forex Brokers with Low Spreads
VERIFIED Low spreads are crucial for reducing trading costs. Explore top Forex brokers offering competitive spreads and high leverage. Compare options for EUR/USD, GBP/USD, USD/JPY, and Gold.