Bitcoin’s BTC $61,207.03 “Uptober” is off to a rocky start. In the first three days of the month, the BTC price dropped from $66,000 to under $60,000.

Moreover, despite Bitcoin’s price three-week general uptrend, it is currently forming a bearish engulfing on the weekly chart, which may indicate a lead to a longer consolidation period before any recovery.

Chart

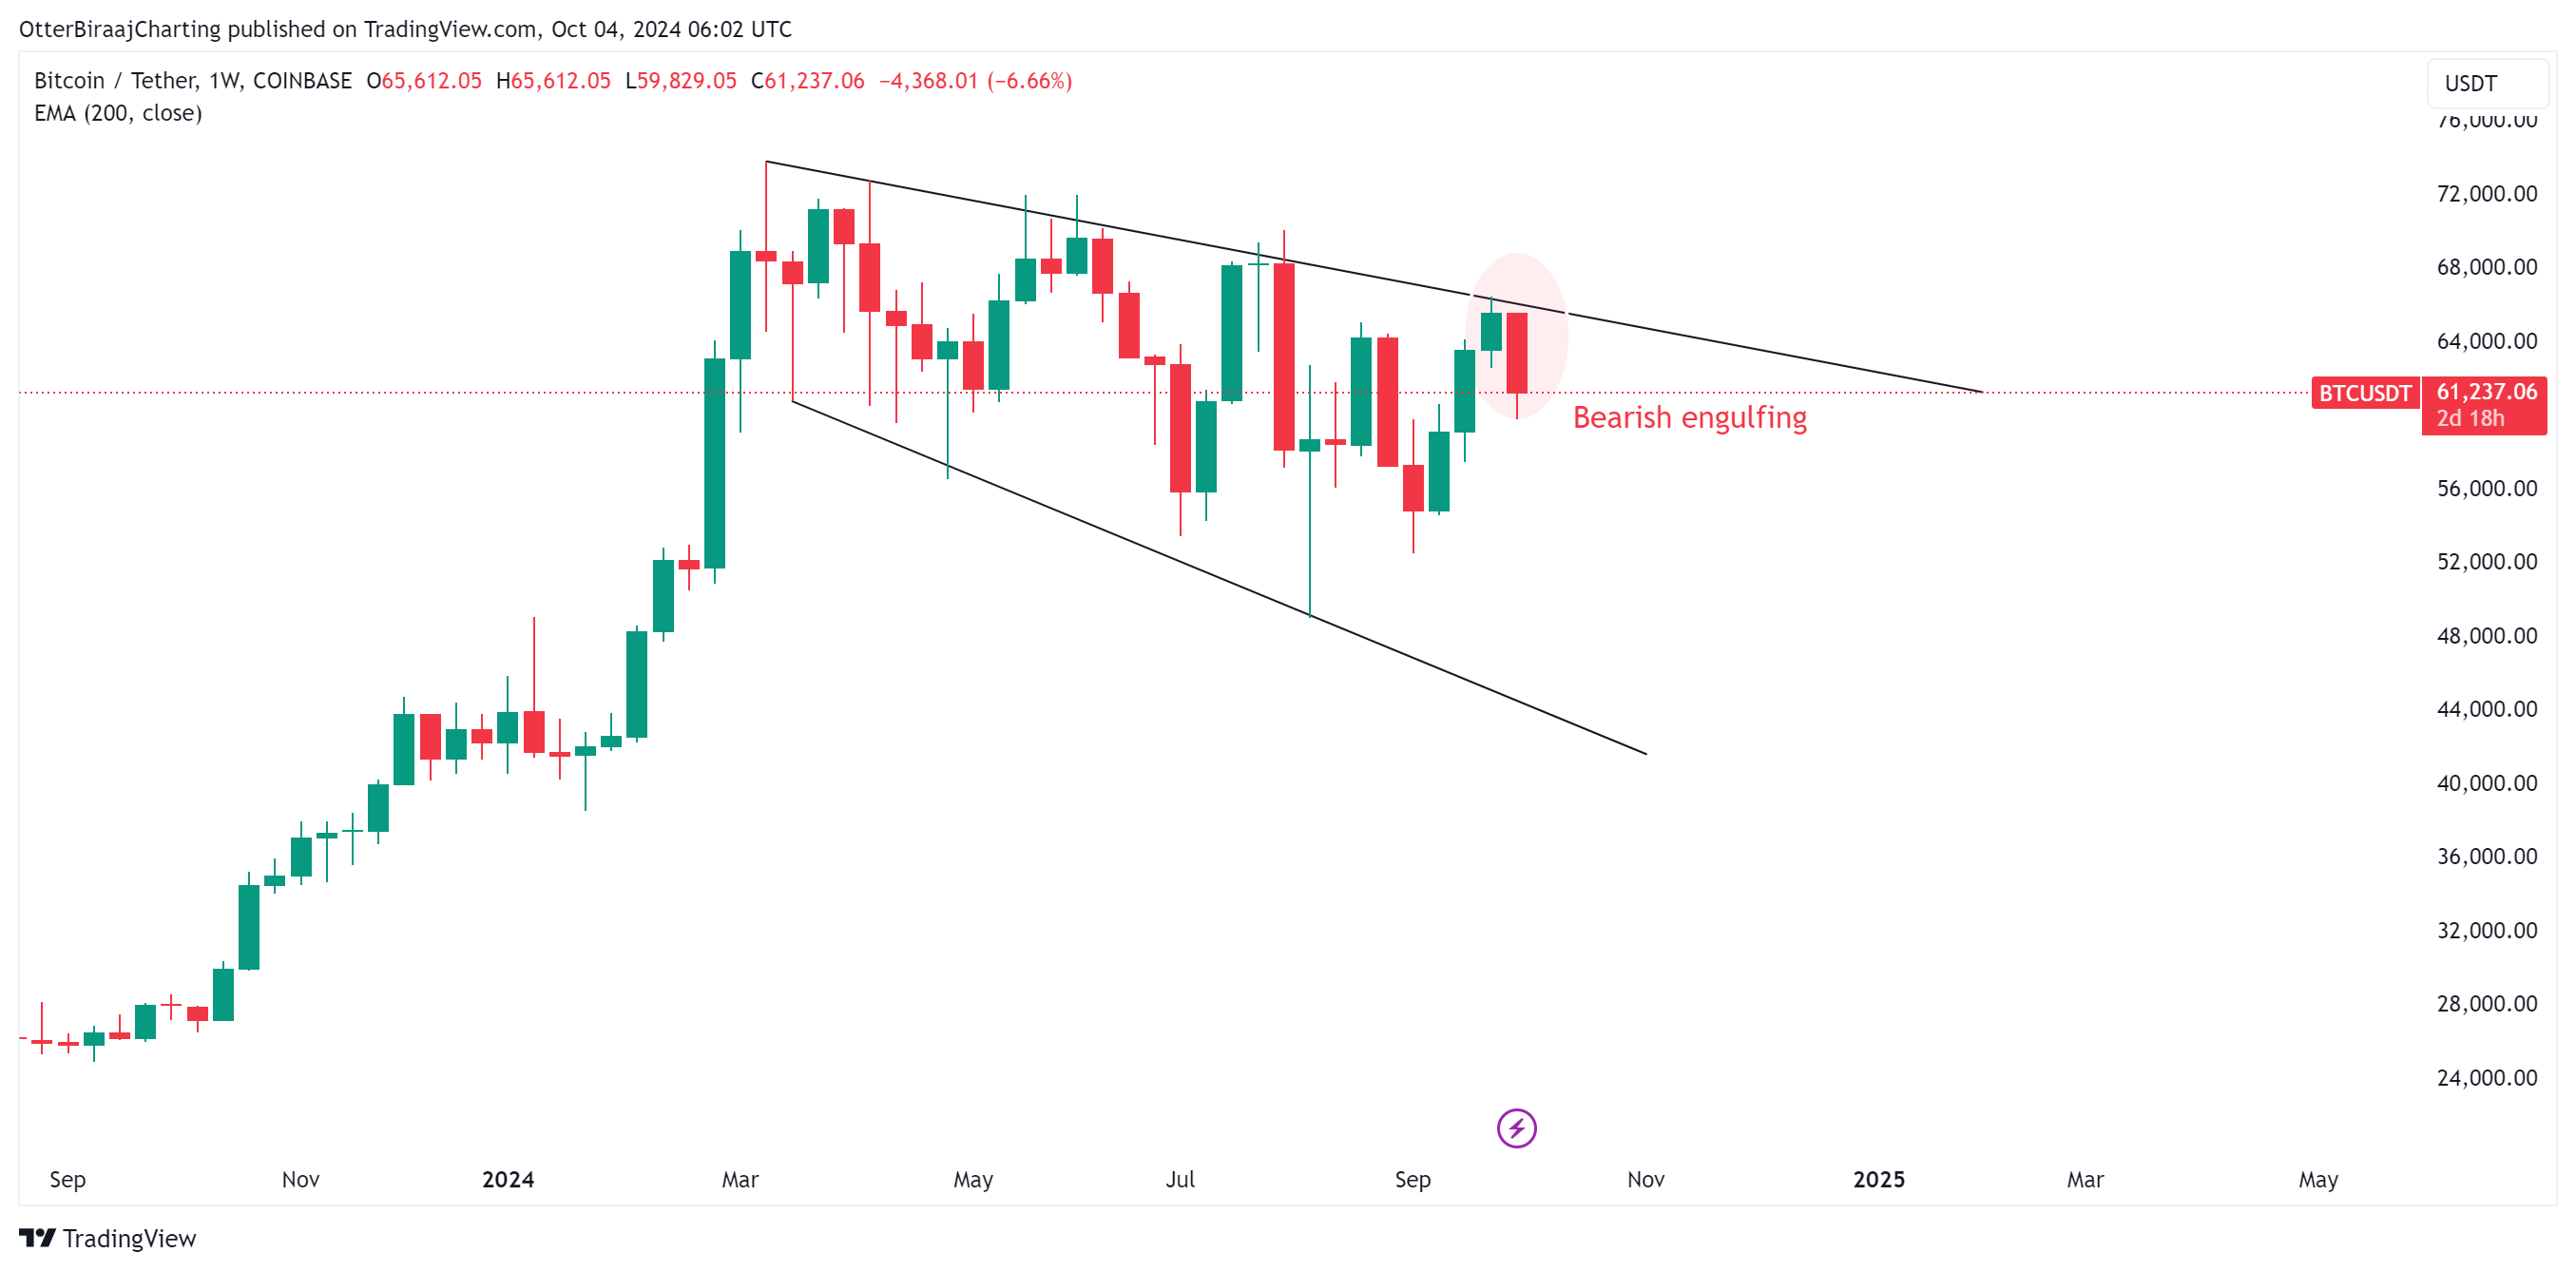
BTC/USDT weekly chart. Source: TradingView

Let’s examine how low the price of Bitcoin could go if the current correction continues for the next few days or weeks.

A “golden zone” recovery 

On Sept. 27, Bitcoin closed a daily candle above its previous local top, forming a bullish higher-high (HH) pattern for the first time in 5-months. This was a major shift in market structure, and it is often ideal for uptrend charts to form a higher low (HL) before the next leg up.

Bitcoin is currently experiencing a bounce from a demand zone between $60,500 and $57,400, which also coincides with the Fibonacci 0.50-0.618 retracement lines. The gap between 0.5 and 0.618 is often described as the golden zone, where high-time frame traders build potential swing positions.

Chart

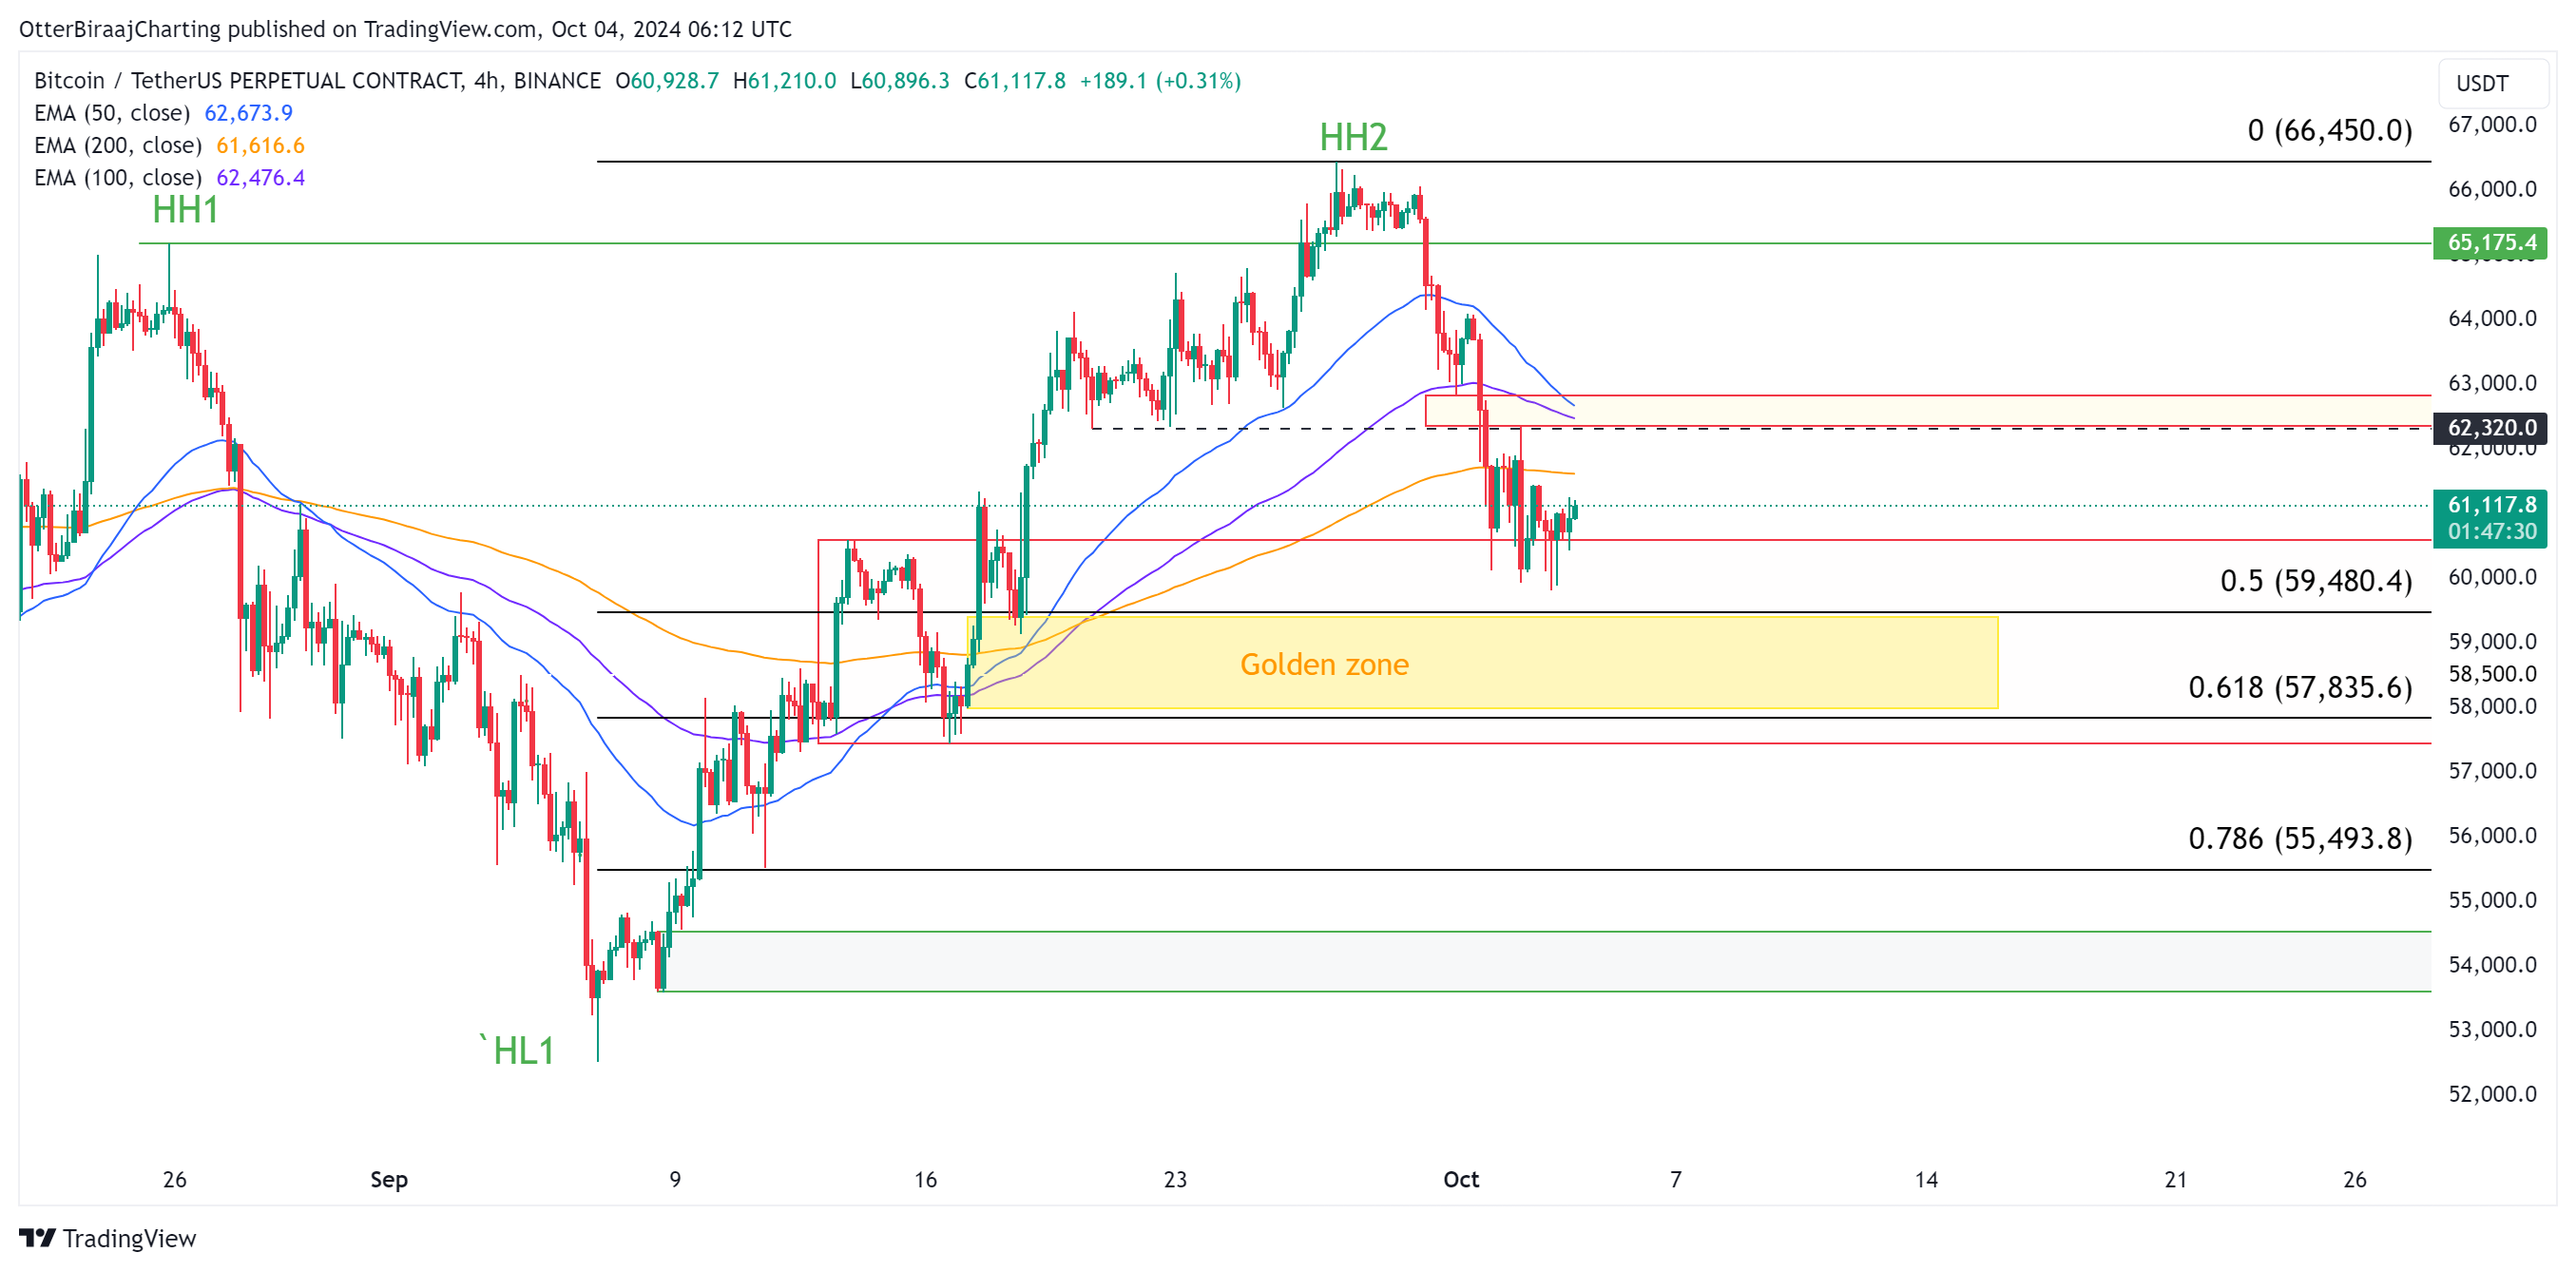
Bitcoin 4-hour chart. Source: TradingView

Bitcoin is currently just above the 0.5-0.618 gap after testing the psychological level at $60,000. But as illustrated in the chart, BTC faces resistance from the 200-EMA indicator. Therefore, there is a high possibility that the price will fall below $60,000 over the next few days.

Dentoshi, an independent analyst, also mentions that losing the 4hr EMA-200 indicates that BTC might chop again and highlights a potential sweep at $57,400, which is the lower range of the golden zone.  

Bitcoin CME gap at $54,000

Bitcoin’s recent price rally began on Sept. 8, after which BTC price gained 18% to $66,140. Previously, a CME gap was formed over the Sept. 6-7 weekend, which did not get filled on the way up.

Chart

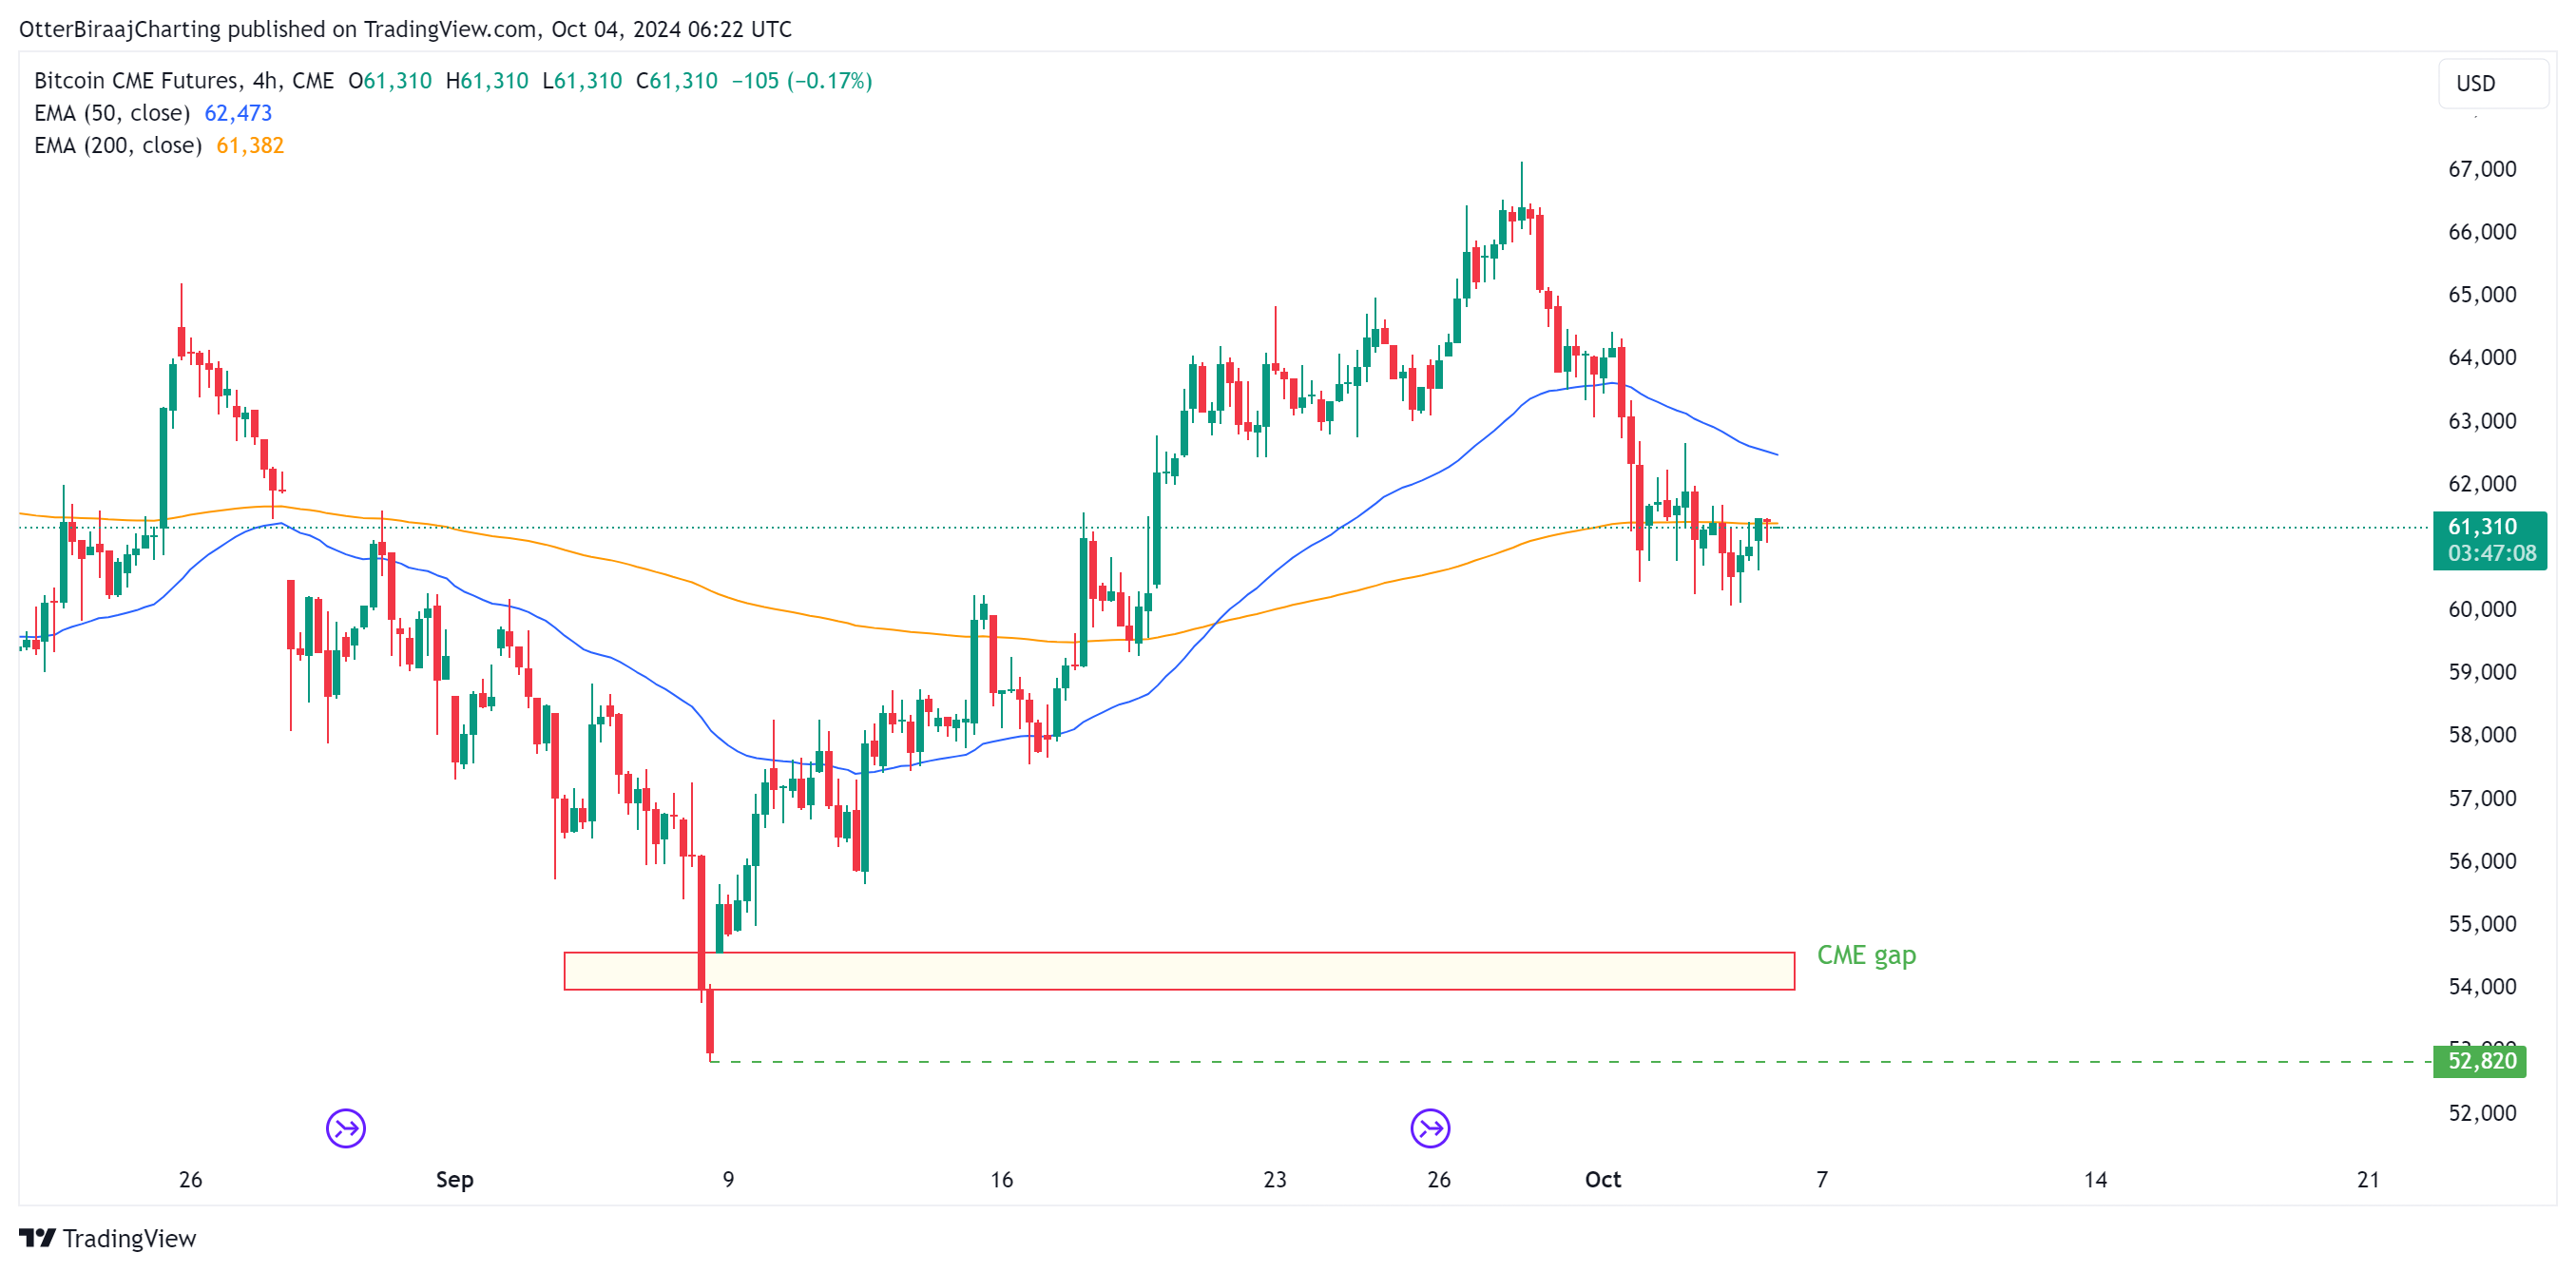
Bitcoin CME gap chart. Source: TradingView

As reported by Cointelegraph, over the past quarter, Bitcoin future CME gaps tend to get “filled,” and this particular gap remains unfilled.

Therefore, retesting the $54,000 Bitcoin CME gap should be the last pivotal range that BTC can drop down to without disrupting its higher high (HH) and higher low trend (HL).

Chart

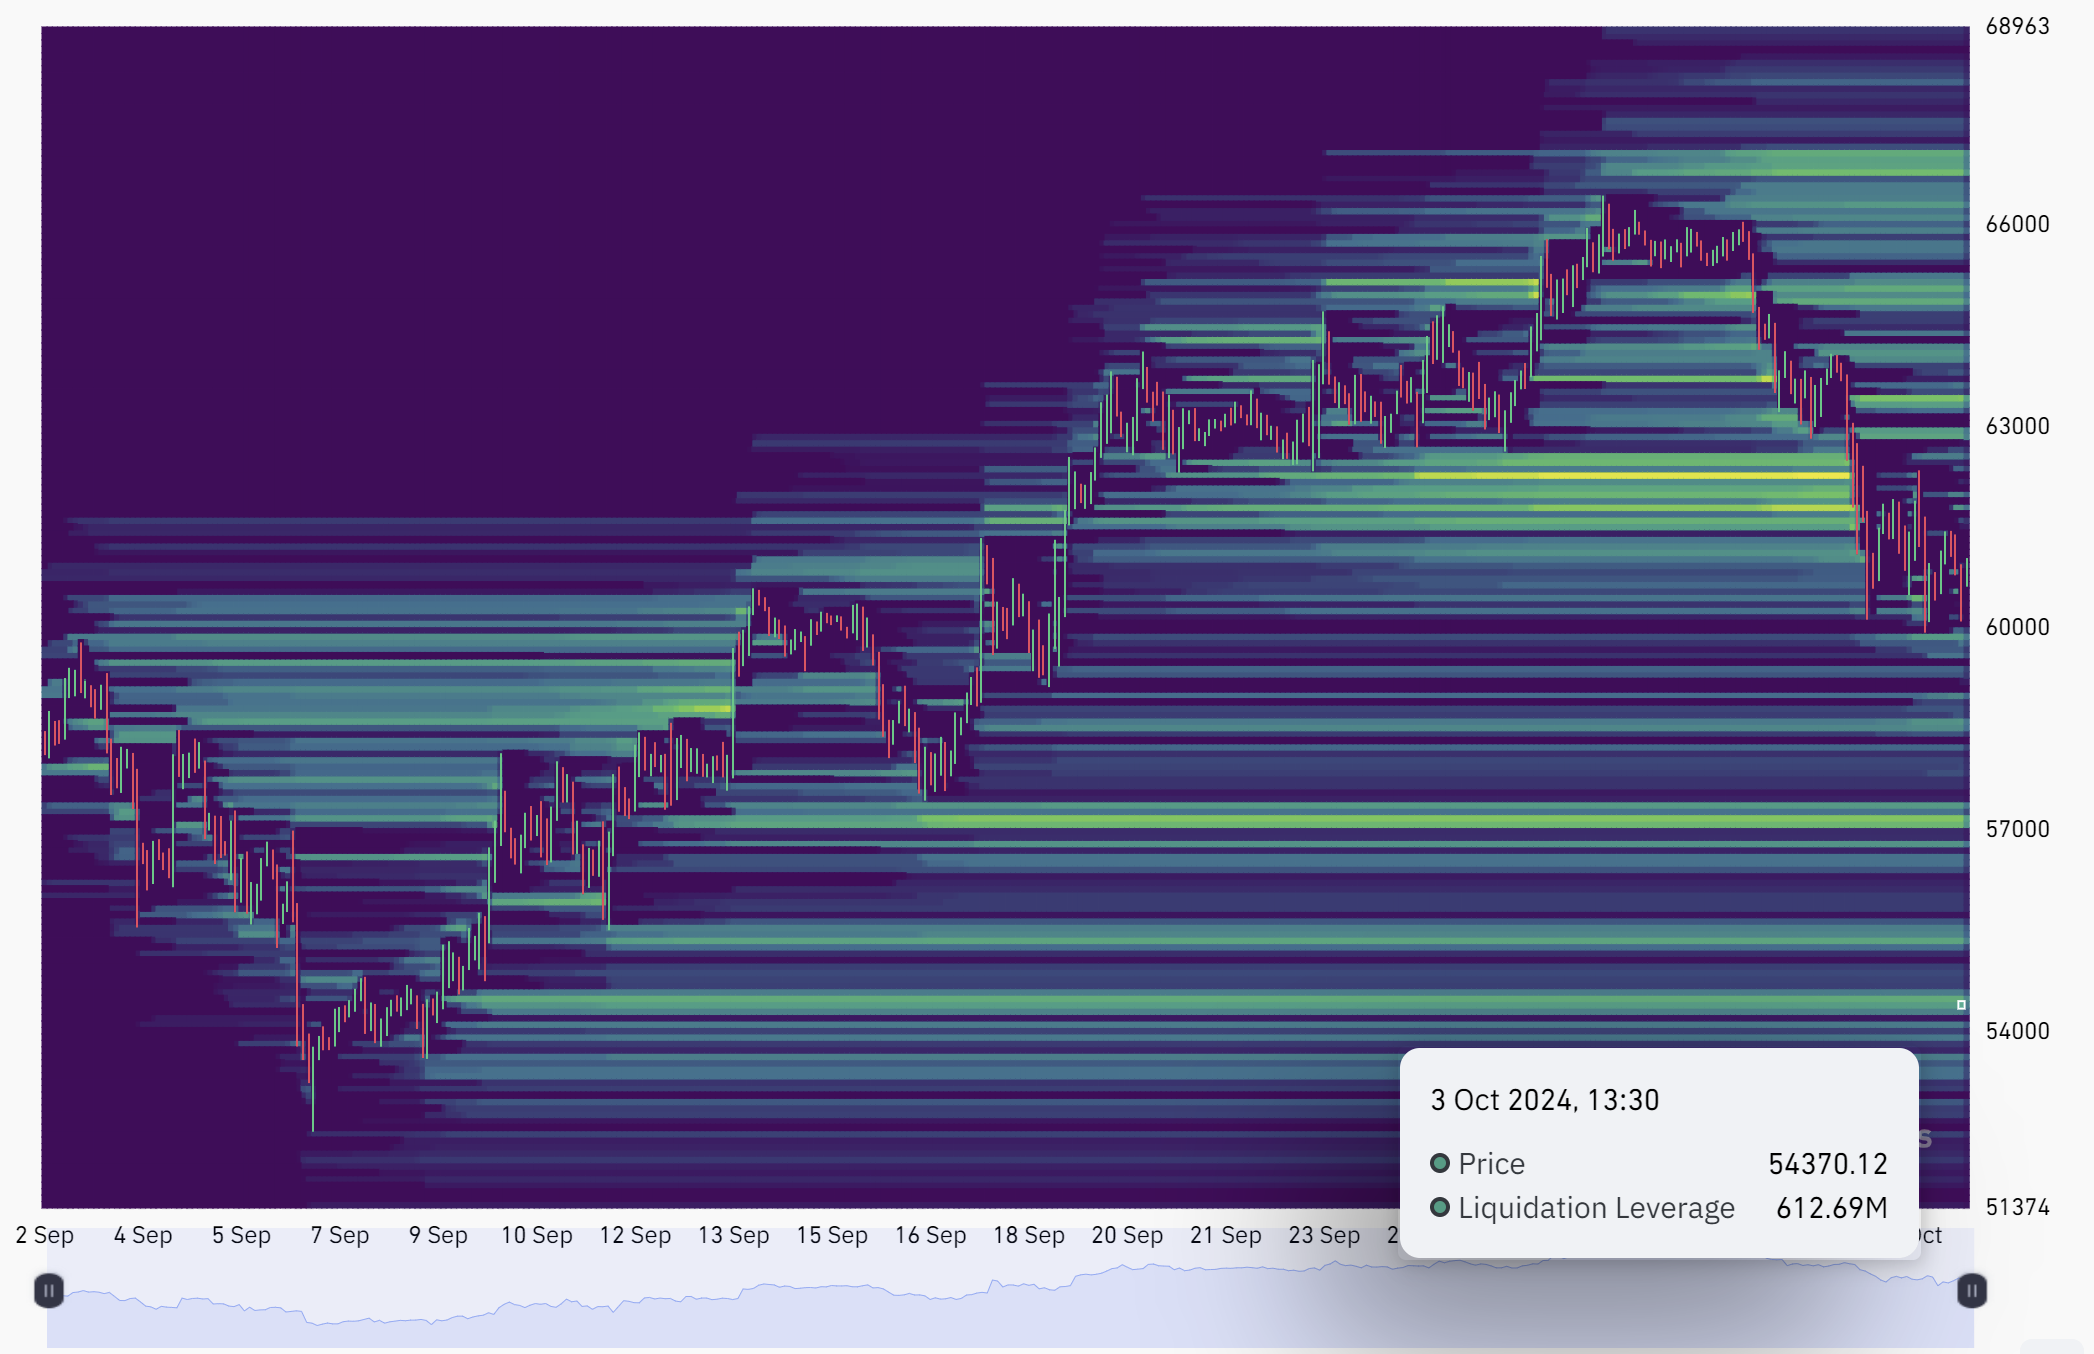
Bitcoin liquidation heatmap. Source: CoinGlass

When looking at Bitcoin liquidation levels, $612 million in liquidation leverage in positional value is also around $54,370, coinciding with the CME gap range.

But if BTC drops further, it will increase its chances of dropping below $52,510 to invalidate the medium and possibly the long-term bullish structure. 


Information on these pages contains forward-looking statements that involve risks and uncertainties. Markets and instruments profiled on this page are for informational purposes only and should not in any way come across as a recommendation to buy or sell in these assets. You should do your own thorough research before making any investment decisions. FXStreet does not in any way guarantee that this information is free from mistakes, errors, or material misstatements. It also does not guarantee that this information is of a timely nature. Investing in Open Markets involves a great deal of risk, including the loss of all or a portion of your investment, as well as emotional distress. All risks, losses and costs associated with investing, including total loss of principal, are your responsibility. The views and opinions expressed in this article are those of the authors and do not necessarily reflect the official policy or position of FXStreet nor its advertisers.

Recommended content


Recommended Content

Editors’ Picks

Ethereum performance could hang on US election due to DeFi's regulatory hurdles

Ethereum performance could hang on US election due to DeFi's regulatory hurdles

Ethereum is down over 4% on Thursday as traders expect high volatility with the US elections approaching. The election results could spark a massive price movement in ETH due to regulatory hurdles the DeFi ecosystem has yet to overcome.

More Ethereum News
Binance market share hit lowest level since 2020 as general exchange trading volume declined

Binance market share hit lowest level since 2020 as general exchange trading volume declined

Binance experienced a notable drop in trading activity in September, per CCData report on Thursday. The report indicated that derivatives trading volume decreased by 21%, reaching $1.25 trillion, the lowest since October 2023. 

More Binance News
XRP declines 4% as Ripple executives slam SEC appeal of Ripple case

XRP declines 4% as Ripple executives slam SEC appeal of Ripple case

XRP extended its losing streak on Thursday. The asset slipped to $0.5208 as traders digested the recent developments in the Securities & Exchange Commission lawsuit. The US financial regulator’s decision to file an appeal on Thursday of the Ripple lawsuit has invited criticism from Ripple executives and XRP holders. 

More Ripple News
Bitcoin is at risk of further decline if it breaks below the key support level

Bitcoin is at risk of further decline if it breaks below the key support level

Bitcoin trades slightly down on Thursday, after declining over 7% this week, and holds near a crucial support level; a sustained close below this threshold could signal further declines ahead.

More Bitcoin News
Bitcoin Weekly Forecast: $70,000 mark on sight as bulls remain strong

Bitcoin Weekly Forecast: $70,000 mark on sight as bulls remain strong

Bitcoin has risen around 3% so far this week, breaking above its range upper limit of $64,700. This gain was supported by increased institutional demand for ETFs, which recorded inflows of more than $612 million this week. 

Read full analysis
Five best Forex brokers in 2024

Five best Forex brokers in 2024

VERIFIED Choosing the best Forex broker in 2024 requires careful consideration of certain essential factors. With the wide array of options available, it is crucial to find a broker that aligns with your trading style, experience level, and financial goals. 

Read More

BTC

ETH

XRP