- Ethereum price is retesting the support confluence, ranging from $3,000 to $2,800.
- A breakdown of this barrier could lead to a steep correction to $2,000.
- Short-term on-chain metrics suggest that a further move to the south is possible.
Ethereum price has arrived at a vital support level after crashing for the past week. This downswing puts ETH at a make or break point, indicating that things could go either way. However, if the big crypto continues to stumble, the smart contract token will likely follow suit.
Also read: Dow Jones futures bounce on in line US CPI data
The Merge and the first test
Ethereum developers have been promising massive upgrades to the network to take it from Proof-of-Work (PoW) to Proof-of-Stake (Pos). However, not all the updates have been timely. After countless delays, ETH is finally one step closer to the much-awaited Merge thanks to the recent test by some developers.
Although the launch date for Merge has not been officially announced yet, it is supposed to bring major ramifications to the network, ranging from improved security, higher transaction count, and reduced impact on the environment among others.
This test was conducted on a shadow fork to prevent an impact on the main chain. Parithosh, a developer related to the matter tweeted,
The merge pandas have arrived! mainnet-shadow-fork-1 hit TTD ~half an hour ago. We've been finalizing and producing blocks! We quickly noticed some seemingly minor issues with Nethermind and Besu(triage ongoing). Erigon is currently syncing to head, status update later.
Arthur Hayes, the ex-CEO and founder of BitMEX stated in his blog that post-Merge, institutional investors could flock to ETH since it would serve as a de facto bond with a higher yield than Treasury bonds.
In the same blog, Hayes also predicted the possibility of Ethereum price hitting $10,000 by the end of 2022.
Ethereum price from an optimist’s standpoint
Ethereum price has crashed roughly 17% after getting rejected at the 200-day Simple Moving Average (SMA) at $3,491. This move comes after multiple rejections since January 13 and is a significant development that has pushed it below the volume profile’s high volume node at $3,136.
However, this downswing has pushed ETH toward the immediate support confluence at roughly $3,000, consisting of the $2,820 to $2,966 demand zone, the 50-day and 100-day SMAs. Therefore, investors can expect a bounce off this level to kick-start another run-up.
The resulting rally needs to pass through the high volume node at $3,136 and grapple with the 200-day SMA at $3,491. In some cases, this move could pierce higher to fill the low volume node extending up to $3,703.
Only in a highly bullish scenario will Ethereum price retest the $4,000 psychological level.
ETH and its worse-case scenario
While the above outlook takes an optimist’s approach, a dire case scenario includes a breakdown of the support confluence, extending from $3,000 to $2,800. A decisive move below this area will confirm a bearish breakout and open the path for bears to take control.
In such a case, the Ethereum price will free fall to $2,541, which is a key support level that will prevent a further crash to $1,968. In a dire scenario, a sub-$2,000 level ETH could be a possibility, especially if the big crypto is also crashing.
Moreover, the volume profile also thins out considerably below $2,541, further adding credence to the downtrend scenario.
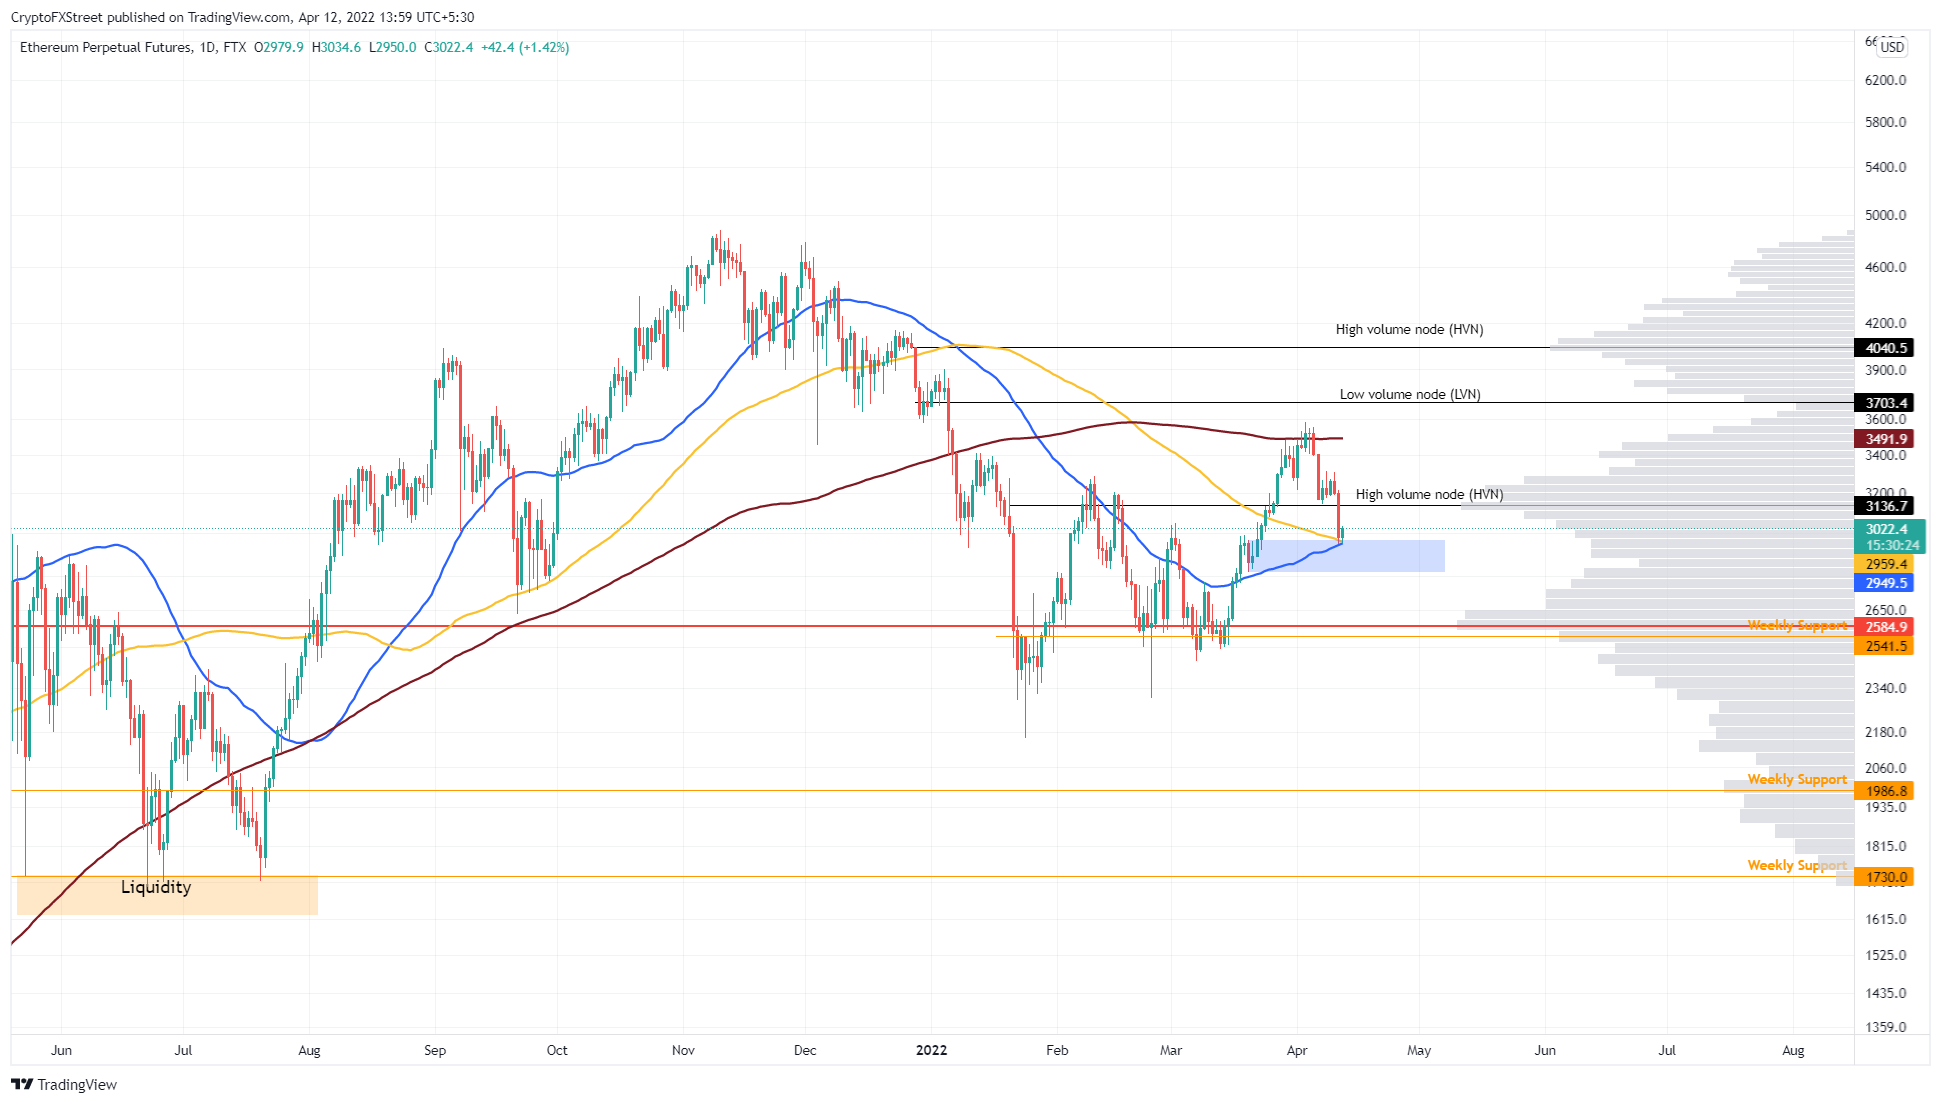
ETH/USDT 1-day chart
Supporting the forecast for a slow and steady uptrend for Ethereum price is a recent uptick in one-hour active addresses from 35,000 to 60,000. This sudden surge was seen on April 5 and comes after months of sideways movement.
The trend change indicates that investors are interacting with the ETH blockchain and are likely buying the dip after the recent crash.
While the rise in active addresses is no doubt bullish, the on-chain volume has been producing a lower high since April 2 and predicts that an uptrend might be delayed.
 [08.36.35, 12 Apr, 2022]-637853500533651121.png)
ETH active addresses vs on-chain volume
Supporting the bearish outlook is the 30-day Market Value to Realized Value (MVRV) model. This on-chain metric is used to determine the average profit/loss of investors that purchased ETH over the past month.
Currently, the index is hovering around -6% but as historical data shows, a local bottom is forming at around -10%, indicating that there is more room to the south.
 [08.42.22, 12 Apr, 2022]-637853500825133950.png)
ETH 30-day MVRV
Despite forces looking balanced for Ethereum price, the support confluence is a key determinant for the direction of the cryptocurrency in the near future. A breakdown could knock ETH to $2,541 and in some cases, $1,730. A bounce off the same support area could be key in triggering a run-up that shatters through the 200-day SMA at $3,491 and retests the $4,000 psychological level.
Information on these pages contains forward-looking statements that involve risks and uncertainties. Markets and instruments profiled on this page are for informational purposes only and should not in any way come across as a recommendation to buy or sell in these assets. You should do your own thorough research before making any investment decisions. FXStreet does not in any way guarantee that this information is free from mistakes, errors, or material misstatements. It also does not guarantee that this information is of a timely nature. Investing in Open Markets involves a great deal of risk, including the loss of all or a portion of your investment, as well as emotional distress. All risks, losses and costs associated with investing, including total loss of principal, are your responsibility. The views and opinions expressed in this article are those of the authors and do not necessarily reflect the official policy or position of FXStreet nor its advertisers. The author will not be held responsible for information that is found at the end of links posted on this page.
If not otherwise explicitly mentioned in the body of the article, at the time of writing, the author has no position in any stock mentioned in this article and no business relationship with any company mentioned. The author has not received compensation for writing this article, other than from FXStreet.
FXStreet and the author do not provide personalized recommendations. The author makes no representations as to the accuracy, completeness, or suitability of this information. FXStreet and the author will not be liable for any errors, omissions or any losses, injuries or damages arising from this information and its display or use. Errors and omissions excepted.
The author and FXStreet are not registered investment advisors and nothing in this article is intended to be investment advice.
Recommended Content
Editors’ Picks

Shiba Inu eyes positive returns in April as SHIB price inches towards $0.000015
Shiba Inu's on-chain metrics reveal robust adoption, as addresses with balances surge to 1.4 million. Shiba Inu's returns stand at a solid 14.4% so far in April, poised to snap a three-month bearish trend from earlier this year.

AI tokens TAO, FET, AI16Z surge despite NVIDIA excluding crypto-related projects from its Inception program
AI tokens, including Bittensor and Artificial Superintelligence Alliance, climbed this week, with ai16z still extending gains at the time of writing on Friday. The uptick in prices of AI tokens reflects a broader bullish sentiment across the cryptocurrency market.

Bitcoin Weekly Forecast: BTC consolidates after posting over 10% weekly surge
Bitcoin price is consolidating around $94,000 at the time of writing on Friday, holding onto the recent 10% increase seen earlier this week. This week’s rally was supported by strong institutional demand, as US spot ETFs recorded a total inflow of $2.68 billion until Thursday.

XRP price could renew 25% breakout bid on surging institutional and retail adoption
Ripple price consolidates, trading at $2.18 at the time of writing on Friday, following mid-week gains to $2.30. The rejection from this weekly high led to the price of XRP dropping to the previous day’s low at $2.11, followed by a minor reversal.
Bitcoin Weekly Forecast: BTC consolidates after posting over 10% weekly surge
Bitcoin (BTC) price is consolidating around $94,000 at the time of writing on Friday, holding onto the recent 10% increase seen earlier this week.

The Best brokers to trade EUR/USD
SPONSORED Discover the top brokers for trading EUR/USD in 2025. Our list features brokers with competitive spreads, fast execution, and powerful platforms. Whether you're a beginner or an expert, find the right partner to navigate the dynamic Forex market.