How growing DOGE holders could impact Dogecoin price
- Dogecoin price is struggling to break out but shows a decent probability of a bullish move.
- Investors should expect a volatile 18% move as on-chain metrics also suggest the same.
- A four-hour candlestick close below $0.076 will invalidate the bullish thesis.

Dogecoin price continues to coil up, hinting that a volatile move is on its way soon. Adding evidence from on-chain metrics leans the scales favoring bulls.
Dogecoin price and bullish narratives
Dogecoin price shows a descending triangle formation by connecting the four lower highs and three equal lows formed since May 12 using trend lines. This technical formation forecasts an 18% move obtained by adding the distance between the first swing high and the swing low to the breakout point.
While a descending triangle has a bearish bias, the recent recovery actually suggests a potential for bullish recovery. Adding credence to this outlook is that price has flipped the $0.082 resistance barrier into a support floor.
Investors need to wait for a decisive four-hour candlestick close above $0.087 to confirm a bullish breakout. Once this development occurs, the theoretical target lies at $0.100, obtained by measuring the distance between the first swing high and swing low to the breakout point at $0.087.
Despite a bullish breakout, DOGE needs to overcome the $0.093 hurdle to reach its theoretical target. In some cases, this move could extend to $0.101.
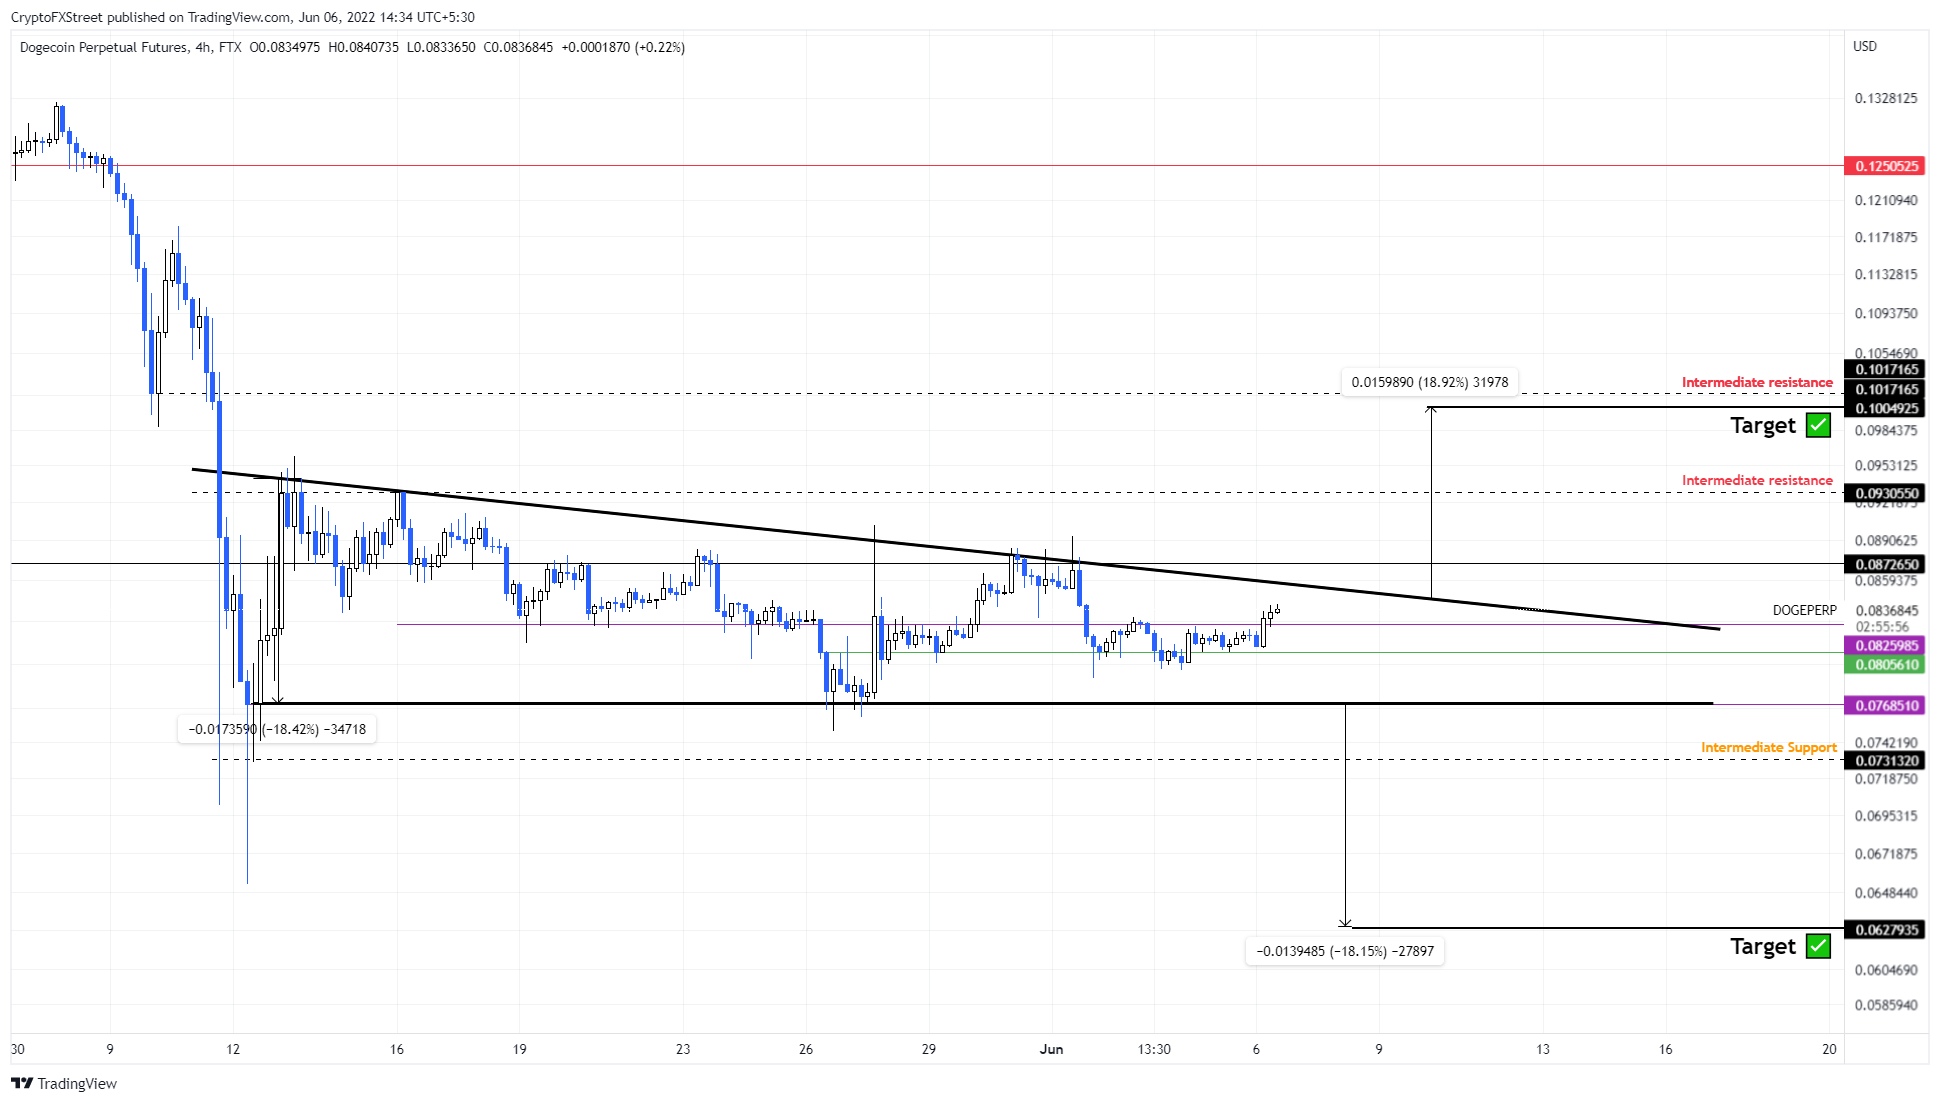
DOGE/USDT 4-hour chart
Supporting this bullish outlook for Dogecoin price is the increase in the number of addresses holding DOGE for more than a year. The count of these market participants has increased from 1.74 million on May 8 to 2.49M as of June 5.
This 43% spike in long-term investors indicates that these buyers are confident in the bullish performance of the Dogecoin price
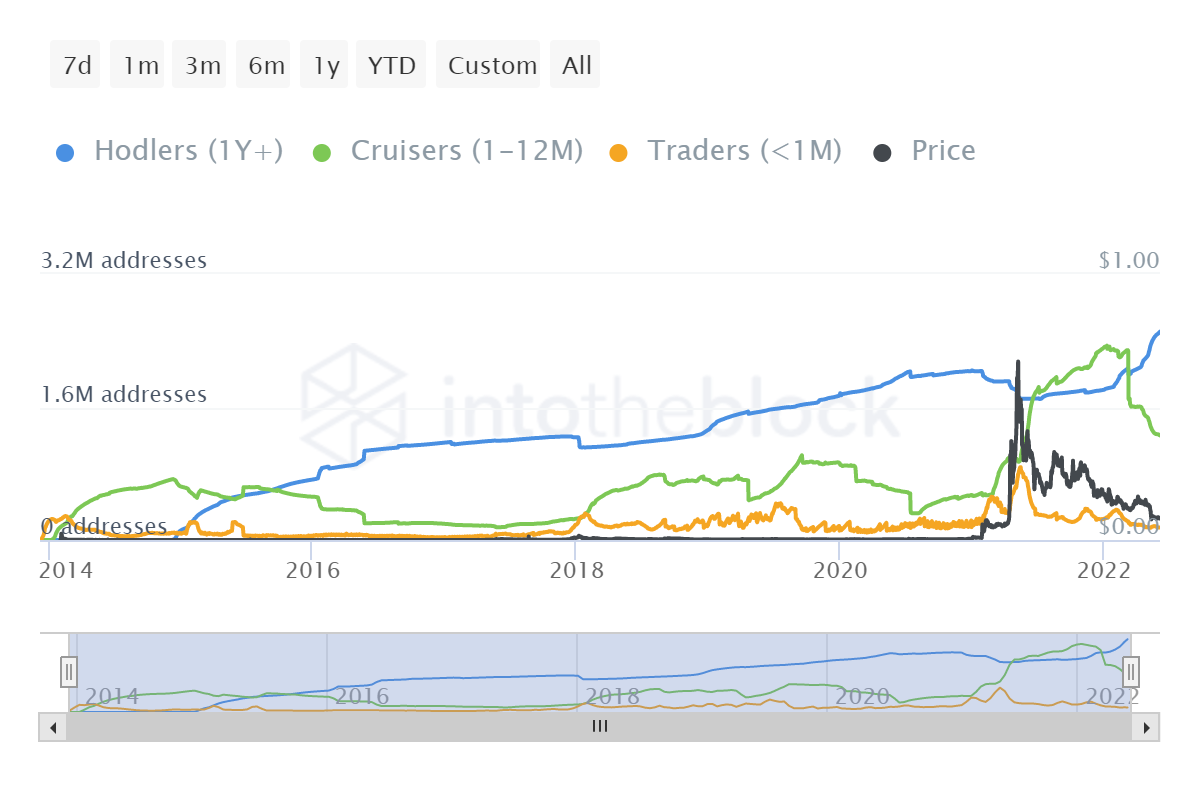
DOGE addresses by time held
Regardless of the bullish technicals and on-chain metrics, a correction or sell-off in Bitcoin price could stop or hinder bulls’ plans dead in their tracks. Investors need to be cautious about a sudden reversal in Dogecoin price that produces a four-hour candlestick close below $0.076.
Such a move would constitute a bearish breakout from the descending triangle and invalidate the bullish thesis. In such a case, the theoretical forecasts reveal an 18% crash to the $0.062 support floor.
Author

Akash Girimath
FXStreet
Akash Girimath is a Mechanical Engineer interested in the chaos of the financial markets. Trying to make sense of this convoluted yet fascinating space, he switched his engineering job to become a crypto reporter and analyst.


