Here’s why XRP price will skyrocket to $15
- XRP price is forming a cup-and-handle pattern on a weekly time frame, hinting at a bullish breakout to $15.
- The RSI and MACD also present supporting evidence for the highly optimistic outlook.
- If Ripple wins its long-standing lawsuit with the SEC, it will set an example of how cryptocurrencies will be regulated for years to come.

XRP price has been struggling lately on a lower time frame, while altcoins are enjoying massive bull rallies. However, on the weekly chart, Ripple indicates that it is forming a massive bullish pattern that could propel it higher.
XRP price reveals bullish technicals
XRP price has been less volatile the past two weeks, while altcoins like Shiba Inu and others have more than doubled in less than six days. Interestingly, Ripple shows a massive bullish setup, the“cup and handle,” on a 2-week chart.
This technical formation consists of a rounding bottom that forms a cup and a smaller ‘U’ shape consolidation to its right, referred to as the handle. A decisive close above the line connecting the peaks of the cup and handle indicates a breakout and forecasts a 906% ascent, determined by measuring the distance between the cup’s lowest part and its right peak. Adding this measure to the breakout point reveals a target of $15.30.
However, XRP price will need to slice through its 2018 all-time high at $3.32 and rally exponentially to reach a new record high at $15.30.
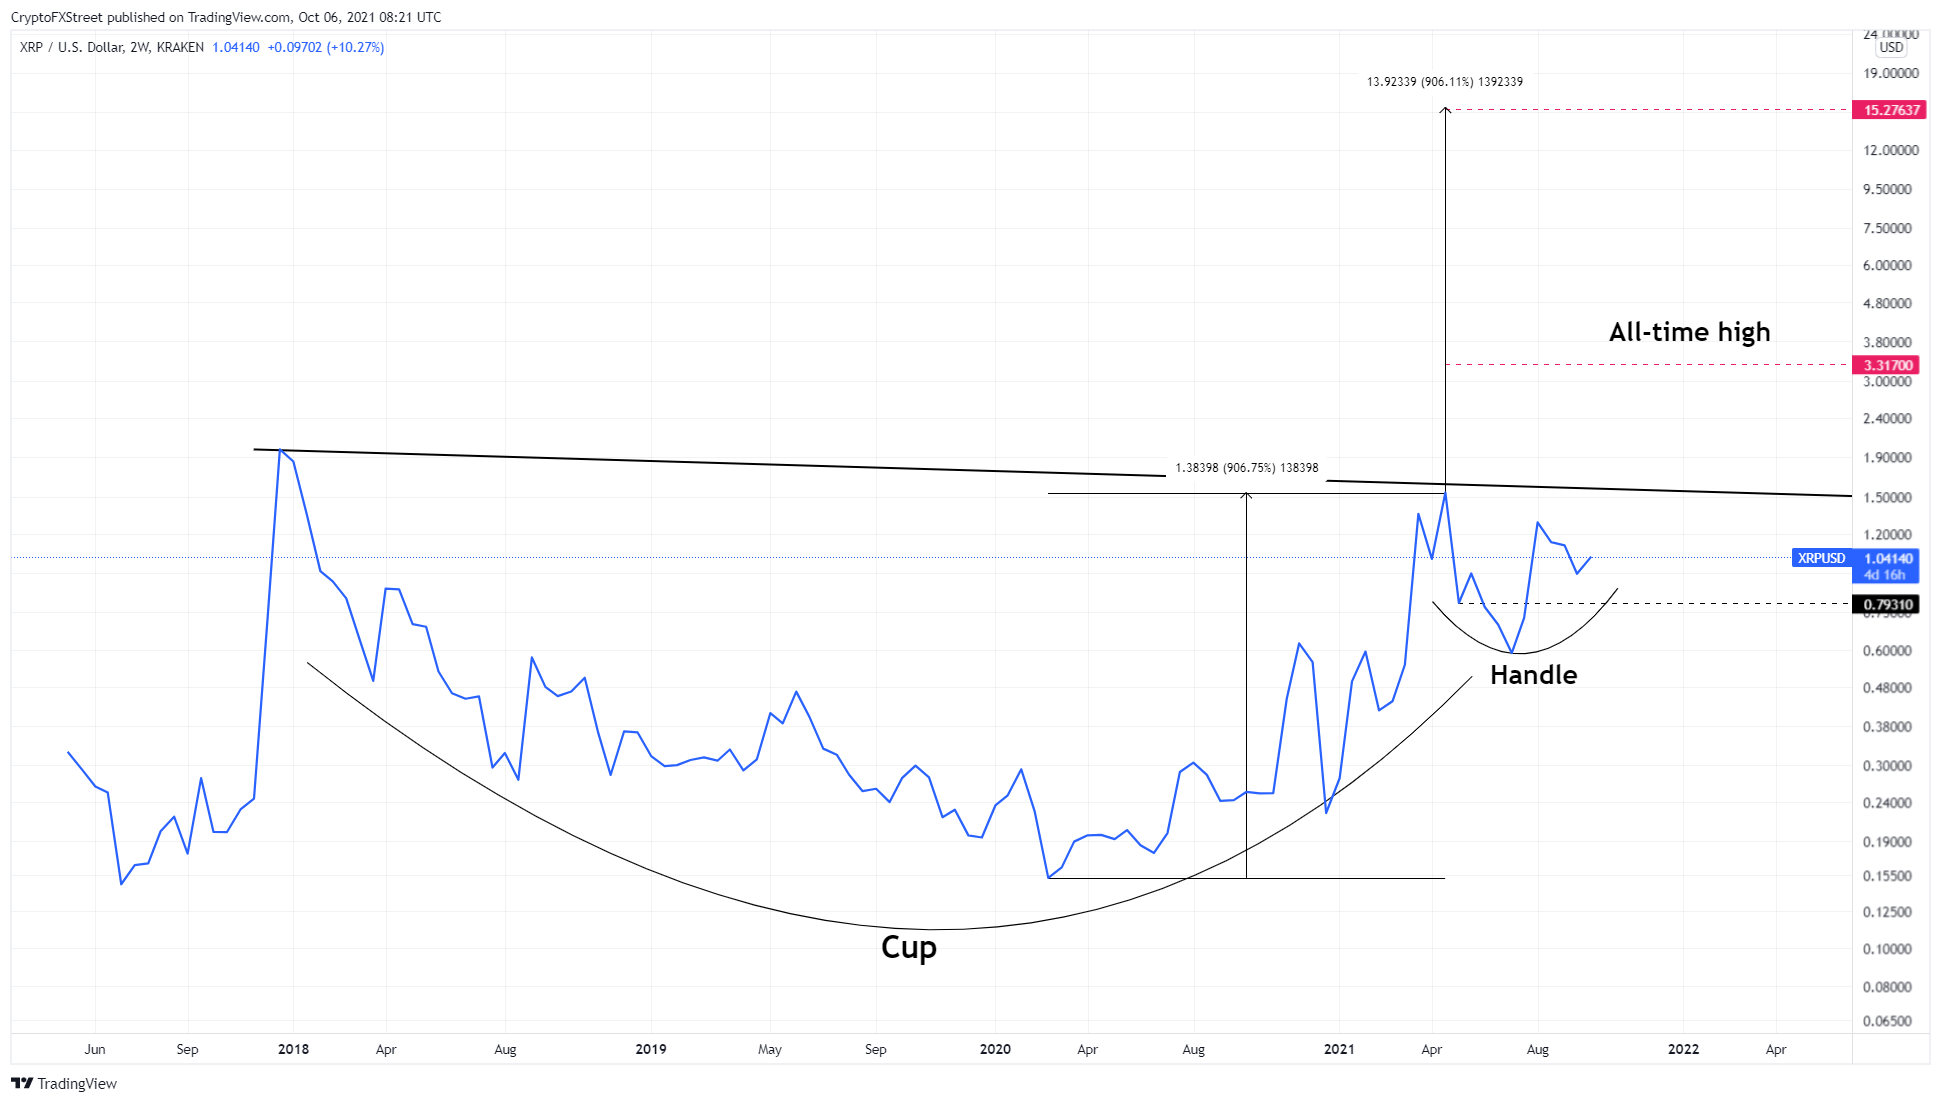
XRP/USD 2-week chart
While the technical formation projects a double-digit target, the Relative Strength Index (RSI) supports this scenario since it is hovering at 55, well below the overbought zone. Moreover, the inclined support line connecting the higher lows that RSI has formed since March 2, 2020, paints a positive picture of the ongoing trend.
Therefore, investors can expect any short-term downswings to bounce off this 574-day-old trend line.
Additionally, the Moving Average Convergence Divergence (MACD) shows that the MACD line (blue) is above the signal line (orange), which indicates a bullish crossover suggesting that the short-term bullish outlook is climbing.
The histogram also shows receding orange lines, hinting at a decrease in selling pressure. If the bullish momentum continues to increase, the histograms will also reveal a bullish crossover, adding credence to the optimistic outlook for the remittance token.
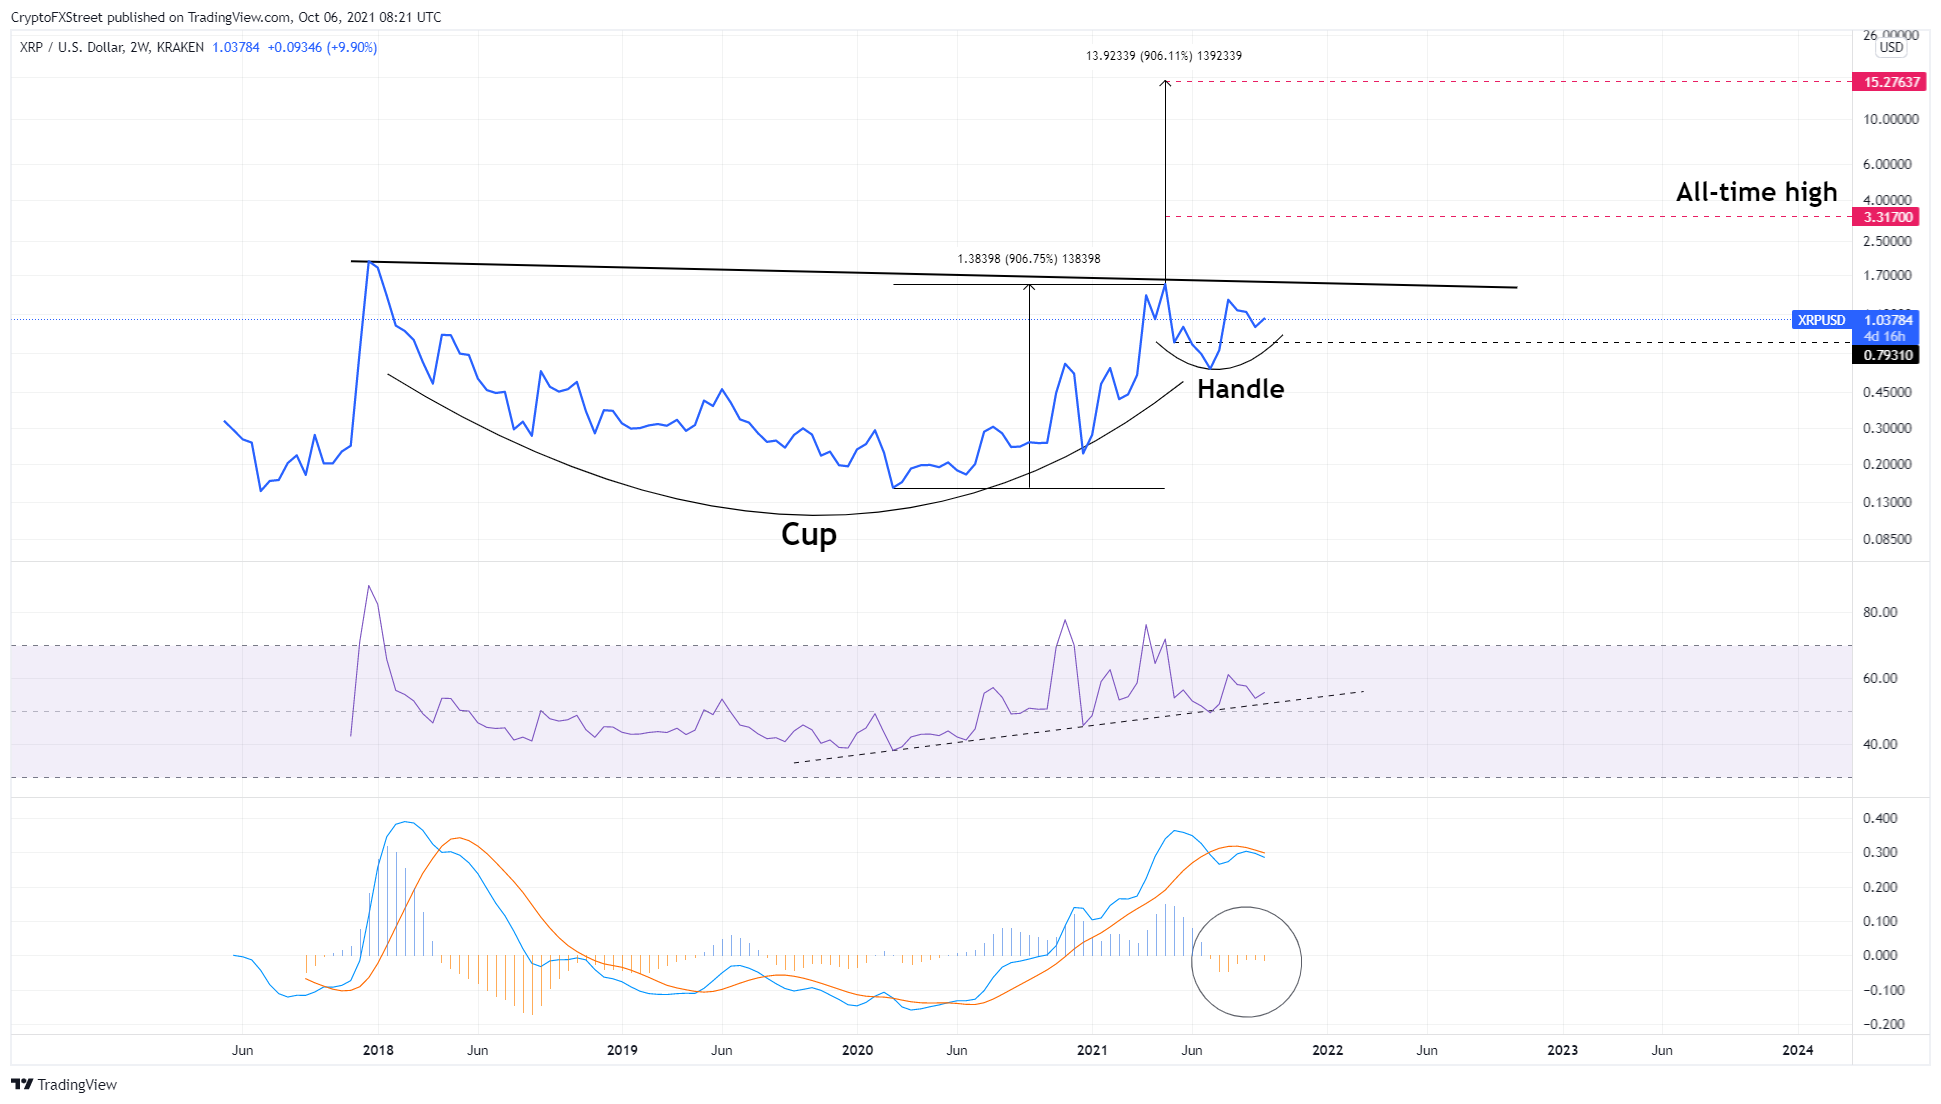
XRPUSD 2-week chart
Ripple and XRP’s defining moment
While the technicals are currently displaying many supporting factors for a double-digit XRP, the fundamentals have to support it.
Perhaps the most significant event that could make or break this prediction depends on the SEC vs. Ripple. Despite having clear rules on what Bitcoin and Ethereum are, XRP seems to have been left behind.
On his last day as the United States Securities & Exchange Commission (SEC) chairman, Jay Clayton sued Ripple for selling unregistered securities in December 2020. Since then, Ripple has been stuck fighting this case against the SEC.
Although XRP price faced the repercussions of the lawsuit initially, it has managed to bounce back splendidly as it trades above $1. This resilience seen in the remittance token could be due to the slew of partnerships Ripple is making in the east.
Congrats @BankDhofar on launching Indian corridor on @Ripple Net. Now Non Resident Indians in Oman can instantly transfer funds to their family back home. https://t.co/Co5bqyIADX
— Navin Gupta (@navinblockchain) April 13, 2021
Additionally, the Japanese government supports Ripple as a commodity like BTC or ETH. Moreover, the payments company has the full support of SBI Holdings, one of the largest banks in Japan. While all of these developments have kept XRP prices afloat, a win with the SEC will be the tipping point since it would, metaphorically speaking, give the power back to the cryptocurrency projects and put the SEC on a backfoot.
Such a move could also allow partnerships like MoneyGram, which fell apart due to the SEC’s lawsuit, to return. Moreover, it would also enable top cryptocurrency exchanges to relist XRP. All of these developments could propel the token past its all-time high at $3.32 and hit a new one.
Author

Akash Girimath
FXStreet
Akash Girimath is a Mechanical Engineer interested in the chaos of the financial markets. Trying to make sense of this convoluted yet fascinating space, he switched his engineering job to become a crypto reporter and analyst.


