Here is why buying Solana price before another dip is a bad idea
- Solana price has dropped roughly 26% since a sweep of the $44.37 hurdle on July 19.
- This correction is likely to continue its descent and revisit the $31.66 and $24.52 support levels.
- A sudden spike in buying pressure that flips the $47.43 resistance barrier into a support floor will invalidate the bearish outlook.

Solana price shows a lack of strength after piercing an important resistance barrier, denoting an overwhelming increase in sellers. This development has pushed Solana SOL to trigger a full-blow reversal that has pushed it down to where it currently stands.
Solana price plans its next move
Solana price swept the $44.37 hurdle on July 19 after rallying 49% in under a week. This massive move was impressive, but it failed to flip a crucial hurdle at $47.43 into a support floor. As a result of its incapacity and the surge in investors booking profits, SOL started reversing its trend.
Interestingly there are a few levels where liquidity still rests, and depending on the market’s bias, SOL will probably visit these barriers before any chance of a turnaround.
Since SOL is crashing, let’s take a look at the liquidity pools to the downside first.
$31.66 is a support level Solana price has retested three times since June 20 without any massive dips or sweeps below it. Hence, this is the first and the nearest level that market makers might attempt to steer the SOL price to.
Furthermore, the swing lows formed since June 13 were all higher lows with no liquidity runs below them. As a result, a move to the lowest swing low at $25.71 is where SOL might head next. Interestingly, this level is just above a weekly support level at $24.52, which makes this barrier a stable one and worthy of catalyzing a reversal.
Considering the aforementioned liquidity levels, investors can expect a 10% downswing to sweep the $31.66 barrier and a 26% downswing to sweep the $24.52 foothold.
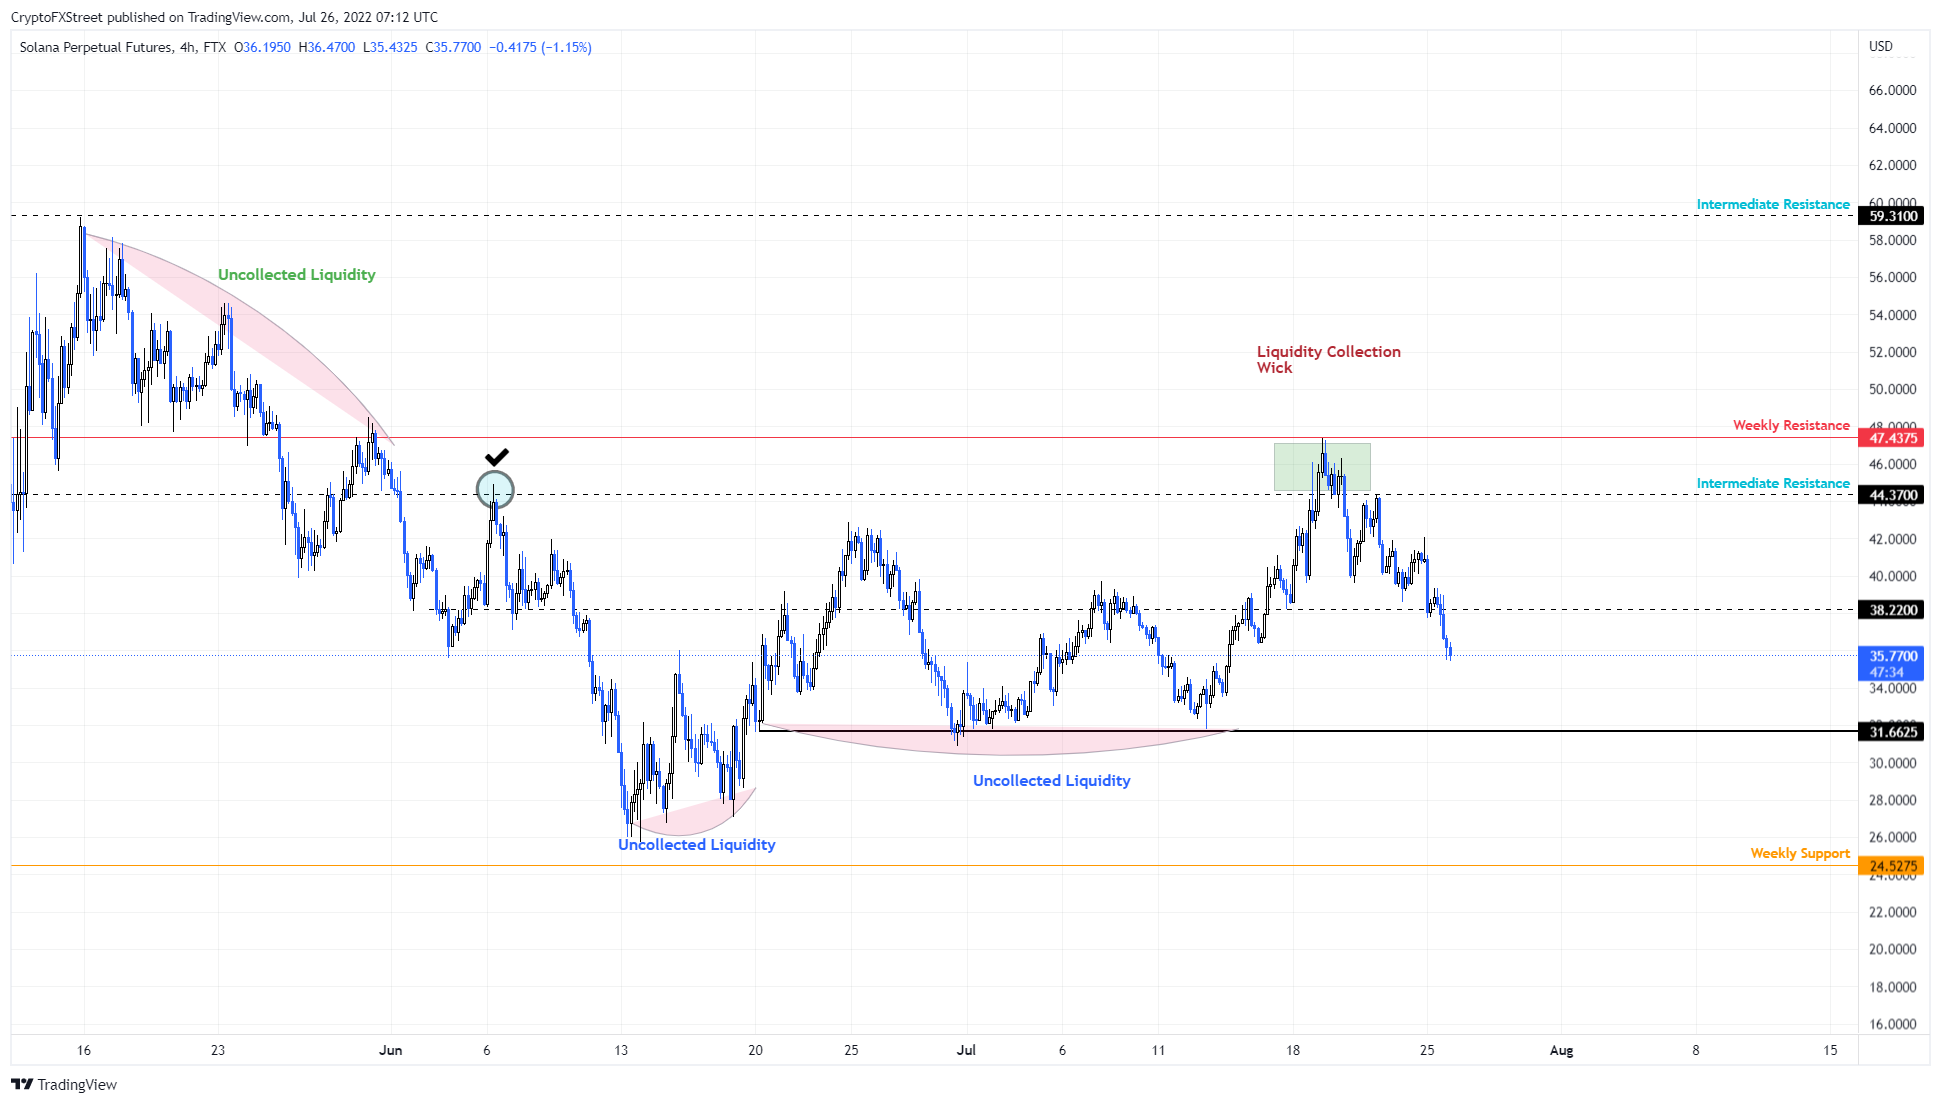
SOL/USDT 4-hour chart
Despite the bearish outlook, a sufficient spike in buying pressure that pushes Solana price to produce a daily candlestick close above $47.43 could reverse the trend. This move will create a higher high and invalidate the bearish thesis.
Such a development could further see Solana price attempt to retest the $50 psychological level.
However, a closer look at the price action reveals that the buy-stop liquidity is resting from roughly $47.43 to $59.31. Hence, the upside for SOL extends up to roughly $60, especially if SOL bulls can manage to overcome the $47.43 hurdle.
Author

Akash Girimath
FXStreet
Akash Girimath is a Mechanical Engineer interested in the chaos of the financial markets. Trying to make sense of this convoluted yet fascinating space, he switched his engineering job to become a crypto reporter and analyst.


