- A surge in Bitcoin whales holding more than 1,000 coins above 43% of the total supply hints at a potential upswing.
- An increase in whale activity has had a direct positive impact on Bitcoin price in the past.
- Bitcoin must reclaim the position above the 50 SMA and $52,000 to sustain the uptrend to $58,000.
Bitcoin whales have for a long time been linked to price actions in the market. When these large volume holders buy more BTC to hold, prices tend to rally. On the other hand, an exodus of the whales culminates in appreciable price drops. Therefore, it is vital to investigate the whales' activities and determine how investors can formulate robust strategies to remain profitable.
How Bitcoin whales influence price action
Bitcoin whales holding 1,000 BTC and more currently take up 42.56% of the total supply. According to on-chain data by Santiment, the swing to the record high of $58,000 in February was directly impacted by whales owning 43.29% of the total supply. Besides, this was a 54-week high. Another surge above 43% would predict another rally in the price of Bitcoin.
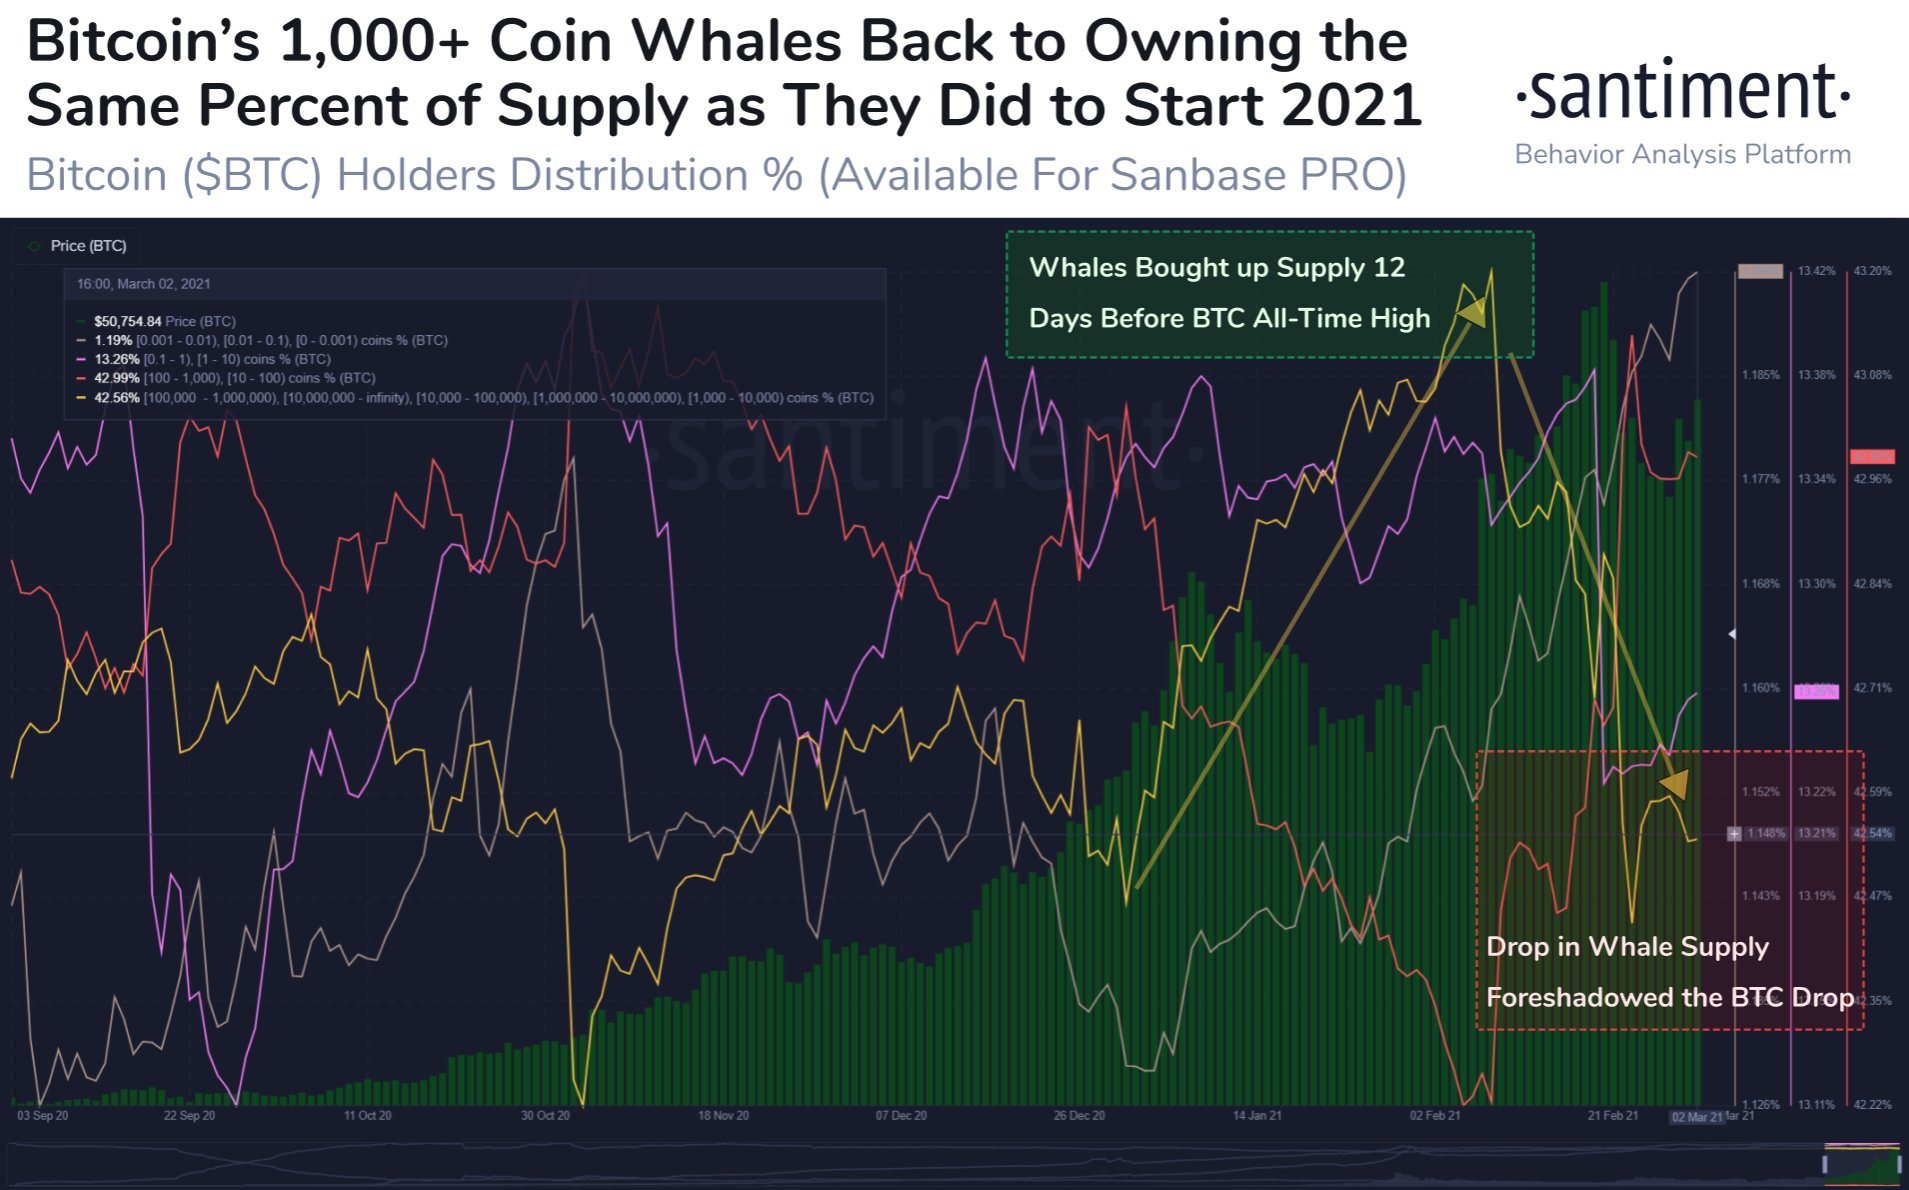
Bitcoin holders with more than 1,000 coins
Scaling down to the whales holding between 100,000 and 1 million BTC confirms the narrative that accumulation is a direct indicator of a bull rally. For instance, the whales in this range increased from only one on January 30 to three by the time Bitcoin hit the record high. Following one of the whales' exit, overhead pressure started to mount, whereby BTC tumbled to $42,800.
A similar upswing was reflected in the number of addresses holding between 1,000 and 10,000 BTC. However, the number of whales in this zone increased appreciably since September 2020 and topped out at 2,390 in the first week of February.
Bitcoin holder distribution
The daily chart illustrates the remarkable upswing to $58,000, which occurred in tandem with the whales' increasing dominance to 43.29% of the total supply. The SuperTrend signal presented a buy signal on the same chart, suggesting, Bitcoin was about to take a swing higher. This also shows that technical indicators can be used in conjunction with whale activity to foresee future price actions.
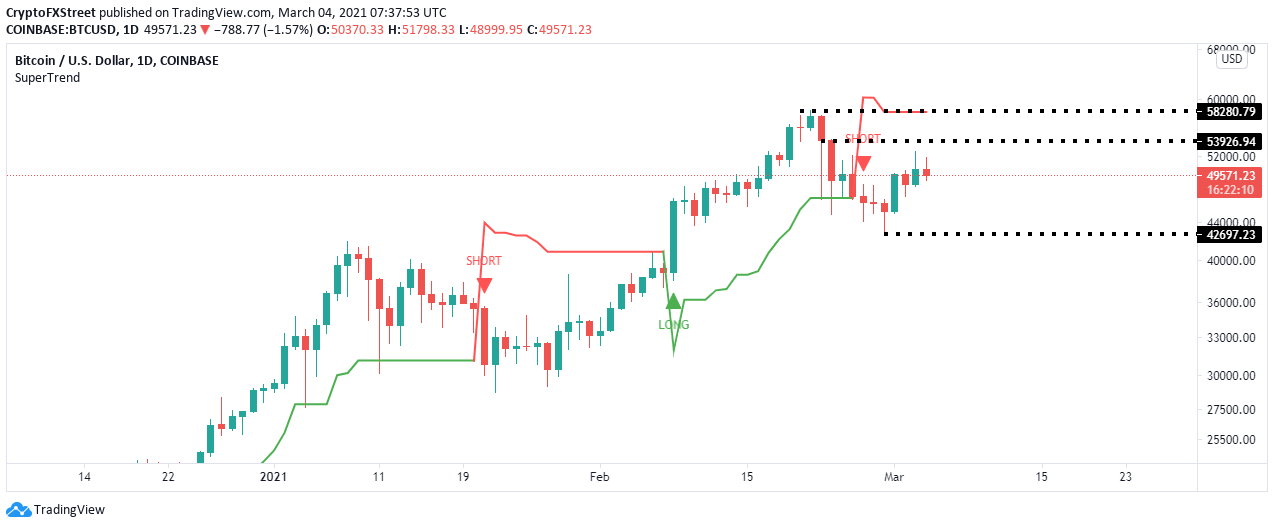
BTC/USD daily chart
A comprehensive look at the whale activity toward the end of 2018 and the first quarter of 2019 echoes the idea that an appreciation in whale activity positively impacts the price of Bitcoin. The chart below shows that all the whales holding 1,000 BTC and above improved consistently from December 2018, when the flagship cryptocurrency dropped to lows of $3,150. The uptake of the pioneer cryptocurrency continued into August, with Bitcoin price hitting highs above $12,000.
Bitcoin slumps under $50,000
At the time of writing, Bitcoin is trading at $49,600 after facing another rejection at $52,000. Overhead pressure seems to be increasing in the wake of losing the 100 Simple Moving Average support on the 4-hour chart. If bulls fail to hold above $489,000, the bearish leg could extend to $48,000, support highlighted by the 50 SMA. More buyers are expected to enter at this level, which may add pressure to the tailwind.
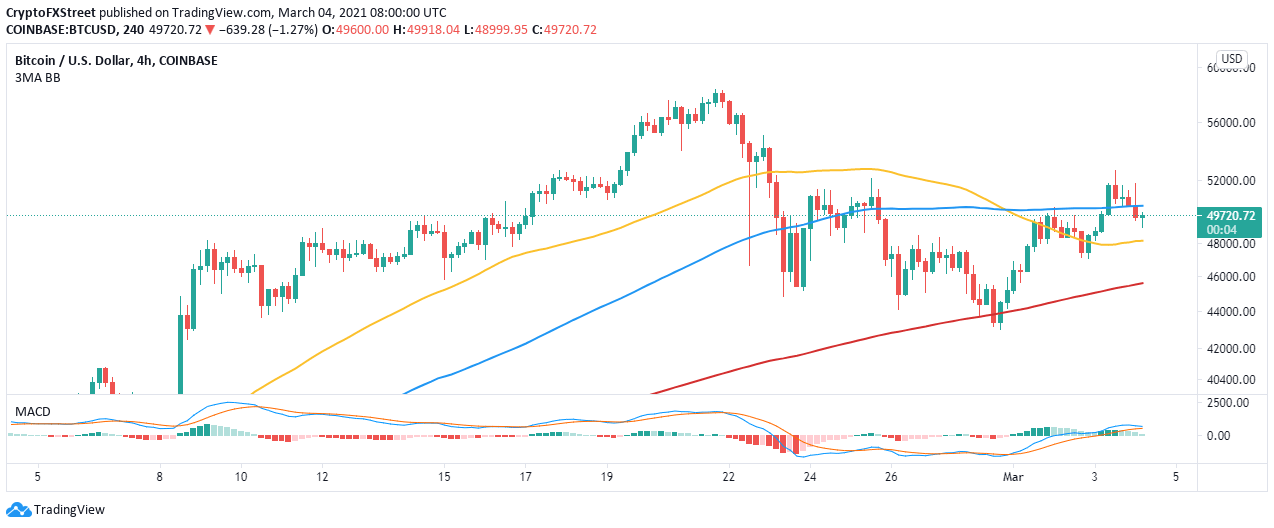
BTC/USD-hour chart
The Moving Average Convergence Divergence (MACD) still has a bullish impulse; therefore, BTC is likely to stay afloat and resume the uptrend above $50,000. Action past $52,000 (stubborn resistance) will trigger more buy orders as investors look forward to the record high and $60,000, respectively.
Information on these pages contains forward-looking statements that involve risks and uncertainties. Markets and instruments profiled on this page are for informational purposes only and should not in any way come across as a recommendation to buy or sell in these assets. You should do your own thorough research before making any investment decisions. FXStreet does not in any way guarantee that this information is free from mistakes, errors, or material misstatements. It also does not guarantee that this information is of a timely nature. Investing in Open Markets involves a great deal of risk, including the loss of all or a portion of your investment, as well as emotional distress. All risks, losses and costs associated with investing, including total loss of principal, are your responsibility. The views and opinions expressed in this article are those of the authors and do not necessarily reflect the official policy or position of FXStreet nor its advertisers. The author will not be held responsible for information that is found at the end of links posted on this page.
If not otherwise explicitly mentioned in the body of the article, at the time of writing, the author has no position in any stock mentioned in this article and no business relationship with any company mentioned. The author has not received compensation for writing this article, other than from FXStreet.
FXStreet and the author do not provide personalized recommendations. The author makes no representations as to the accuracy, completeness, or suitability of this information. FXStreet and the author will not be liable for any errors, omissions or any losses, injuries or damages arising from this information and its display or use. Errors and omissions excepted.
The author and FXStreet are not registered investment advisors and nothing in this article is intended to be investment advice.
Recommended Content
Editors’ Picks
Ripple on-chain metrics show bullish signs amidst legal struggle with SEC, XRP eyes recovery
![Ripple on-chain metrics show bullish signs amidst legal struggle with SEC, XRP eyes recovery](https://editorial.fxstreet.com/images/Markets/Currencies/Cryptocurrencies/Coins/Ripple/Ripple_Coin_31_02_XtraSmall.jpg)
Ripple made a comeback above $0.48 on Tuesday and hovers above that level in Wednesday’s European session. Ripple on-chain metrics such as transaction volume and Network Realized Profit/Loss have turned bullish, supporting a recovery in the altcoin.
Bitcoin price falls amidst German government transfers, miners activity
![Bitcoin price falls amidst German government transfers, miners activity](https://editorial.fxstreet.com/images/Markets/Currencies/Digital%20Currencies/Bitcoin/bit-coin-symbol-flag-3d-illustration-59931110_XtraSmall.jpg)
Bitcoin (BTC) extends correction on Wednesday and hovers around $61,000 after finding resistance near the $64,000 level on Monday. Recent on-chain data indicates heightened selling activity from Bitcoin miners early in the week.
Crypto Today: Bitcoin erases gains from end of June, Ethereum declines while Ripple holds
![Crypto Today: Bitcoin erases gains from end of June, Ethereum declines while Ripple holds](https://editorial.fxstreet.com/images/Markets/Currencies/Digital%20Currencies/Bitcoin/Bitcoin_2_XtraSmall.jpg)
Bitcoin wipes out gains from the last week of June and falls below $60,000 on Wednesday. Ethereum and top altcoins ranked by market capitalization erased gains as the inflation outlook worsened. Ripple holds on to recent gains and hovers above $0.48 on Wednesday.
Three reasons why altcoins could shake off losses this week
![Three reasons why altcoins could shake off losses this week](https://editorial.fxstreet.com/images/Markets/Currencies/Cryptocurrencies/cryptos_XtraSmall.jpg)
On-chain data from Santiment shows that altcoins are currently in the opportunity zone, or generating buy signals. The top three altcoins in the buy zone are Basic Attention Token (BAT), Chromia (CHR), and Highstreet (HIGH), per Santiment.
Bitcoin: BTC price correction could end in July, according to seasonal data
![Bitcoin: BTC price correction could end in July, according to seasonal data](https://editorial.fxstreet.com/images/Markets/Currencies/Digital%20Currencies/Bitcoin/bitcoin_5_XtraSmall.jpg)
Bitcoin (BTC) price appears poised for a decline this week, influenced by slight outflows in US spot ETFs, selling activity among BTC miners, and a combined transfer of 4,690.28 BTC to centralized exchanges by the US and German governments.