- Hedera price is up 2% in the last two days, with prospects for more gains as buying pressure increases.
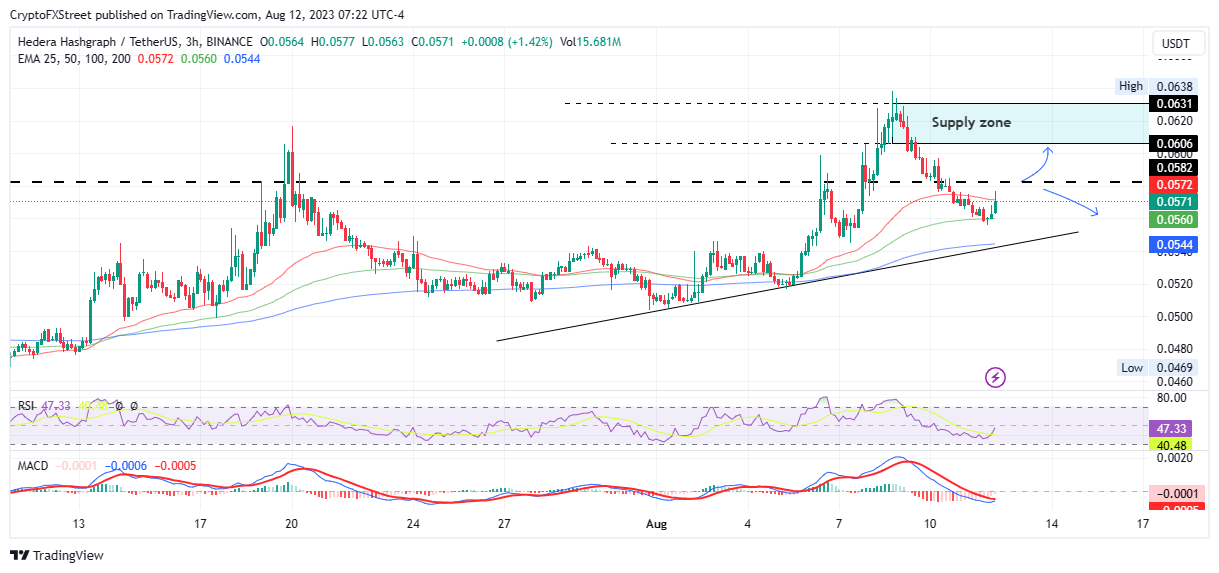
- The surge comes after short traders take profit orders were triggered around the $0.0560 level, marked by the 100-day EMA.
- The ensuing buying pressure could see HBAR rise 5% to the supply zone around $0.0606.
Hedera (HBAR) price is trading with a bullish bias in an attempted recovery from a recent downtrend. The bullishness comes as Bitcoin (BTC) and Ethereum (ETH) continue in a range-bound movement, consolidating along an equilibrium level as the crypto market craves a catalyst.
Hedera price could rally 5% if it breaches $0.0582
Hedera (HBAR) price is en route north after a recent downtrend initiated profit-taking among long traders. The ensuing selling pressure sent HBAR down 10% to find support for the 100-day Exponential Moving Average (EMA) at $0.0560. This is likely around the take profit level for traders who shorted the altcoin, with the subsequent buying pressure initiating the ongoing uptrend.
Hedera Price forecast as new buy orders come in
Hedera (HBAR) price is currently confronting the 50-day EMA at $0.0572, a supplier congestion level that will determine the next move for HBAR. If the altcoin makes a decisive 3-hour candlestick close above this level, it could complete the 5% rally to the supply zone above.
Traders are willing to sell aggressively in the supply zone because once the price hits this order block, the balance would have shifted to the distribution side.
However, if the supply zone fails to hold as resistance and Hedera price shatters through this bearish order block, it would flip into support, thus a bullish breaker. Further north, the altcoin could record a new range high above $0.0638.
HBAR/USDT 3-hour chart
Conversely, if seller momentum overpowers the bulls, Hedera price could drop, potentially writing off the recent gains to tag the 200-day EMA at $0.0545. In the dire case, HBAR could slip through the uptrend line, with a decisive move below this support level invalidating the longstanding uptrend.
The Relative Strength Index (RSI) position below 50 questions the overall bullish outlook, suggesting a not-so-strong momentum. Similarly, the Moving Average Convergence Divergence (MACD) indicator is in the negative zone, making it easy for bears to take over.
Cryptocurrency metrics FAQs
What is circulating supply?
The developer or creator of each cryptocurrency decides on the total number of tokens that can be minted or issued. Only a certain number of these assets can be minted by mining, staking or other mechanisms. This is defined by the algorithm of the underlying blockchain technology. Since its inception, a total of 19,445,656 BTCs have been mined, which is the circulating supply of Bitcoin. On the other hand, circulating supply can also be decreased via actions such as burning tokens, or mistakenly sending assets to addresses of other incompatible blockchains.
What is market capitalization?
Market capitalization is the result of multiplying the circulating supply of a certain asset by the asset’s current market value. For Bitcoin, the market capitalization at the beginning of August 2023 is above $570 billion, which is the result of the more than 19 million BTC in circulation multiplied by the Bitcoin price around $29,600.
What is trading volume?
Trading volume refers to the total number of tokens for a specific asset that has been transacted or exchanged between buyers and sellers within set trading hours, for example, 24 hours. It is used to gauge market sentiment, this metric combines all volumes on centralized exchanges and decentralized exchanges. Increasing trading volume often denotes the demand for a certain asset as more people are buying and selling the cryptocurrency.
What is funding rate?
Funding rates are a concept designed to encourage traders to take positions and ensure perpetual contract prices match spot markets. It defines a mechanism by exchanges to ensure that future prices and index prices periodic payments regularly converge. When the funding rate is positive, the price of the perpetual contract is higher than the mark price. This means traders who are bullish and have opened long positions pay traders who are in short positions. On the other hand, a negative funding rate means perpetual prices are below the mark price, and hence traders with short positions pay traders who have opened long positions.
Information on these pages contains forward-looking statements that involve risks and uncertainties. Markets and instruments profiled on this page are for informational purposes only and should not in any way come across as a recommendation to buy or sell in these assets. You should do your own thorough research before making any investment decisions. FXStreet does not in any way guarantee that this information is free from mistakes, errors, or material misstatements. It also does not guarantee that this information is of a timely nature. Investing in Open Markets involves a great deal of risk, including the loss of all or a portion of your investment, as well as emotional distress. All risks, losses and costs associated with investing, including total loss of principal, are your responsibility. The views and opinions expressed in this article are those of the authors and do not necessarily reflect the official policy or position of FXStreet nor its advertisers. The author will not be held responsible for information that is found at the end of links posted on this page.
If not otherwise explicitly mentioned in the body of the article, at the time of writing, the author has no position in any stock mentioned in this article and no business relationship with any company mentioned. The author has not received compensation for writing this article, other than from FXStreet.
FXStreet and the author do not provide personalized recommendations. The author makes no representations as to the accuracy, completeness, or suitability of this information. FXStreet and the author will not be liable for any errors, omissions or any losses, injuries or damages arising from this information and its display or use. Errors and omissions excepted.
The author and FXStreet are not registered investment advisors and nothing in this article is intended to be investment advice.
Recommended Content
Editors’ Picks

Polygon joins forces with WSPN to expand stablecoin adoption
WSPN, a stablecoin infrastructure company based in Singapore, has teamed up with Polygon Labs to make its stablecoin, WUSD, more useful in payment and decentralized finance.

Coinbase envisages listing of more meme coins amid regulatory optimism
Donald Trump's expected return to the White House creates excitement in the cryptocurrency sector, especially at Coinbase, the largest US-based crypto exchange. The platform is optimistic that the new administration will focus on regulatory clarity, which could lead to more token listings, including popular meme coins.

Cardano's ADA leaps to 2.5-year high of 90 cents as whale holdings exceed $12B
As Bitcoin (BTC) gets closer to the $100,000 mark for the first time — it crossed $99,000 earlier Friday — capital is rotating into alternative cryptocurrencies, creating a buzz in the broader crypto market.

Shiba Inu holders withdraw 1.67 trillion SHIB tokens from exchange
Shiba Inu trades slightly higher, around $0.000024, on Thursday after declining more than 5% the previous week. SHIB’s on-chain metrics project a bullish outlook as holders accumulate recent dips, and dormant wallets are on the move, all pointing to a recovery in the cards.

Bitcoin: Rally expected to continue as BTC nears $100K
Bitcoin (BTC) reached a new all-time high of $99,419, just inches away from the $100K milestone and has rallied over 9% so far this week. This bullish momentum was supported by the rising Bitcoin spot Exchange Traded Funds (ETF), which accounted for over $2.8 billion inflow until Thursday. BlackRock and Grayscale’s recent launch of the Bitcoin ETF options also fueled the rally this week.

Best Forex Brokers with Low Spreads
VERIFIED Low spreads are crucial for reducing trading costs. Explore top Forex brokers offering competitive spreads and high leverage. Compare options for EUR/USD, GBP/USD, USD/JPY, and Gold.
