- Hedera Hashgraph price trades with a bearish bias, looking at more losses before a possible trend reversal.
- HBAR could drop almost 7% to the $0.057 support level before a possible correction.
- The bearish narrative will be invalidated upon a decisive candlestick close above the 200-day EMA at $0.068.
Hedera Hashgraph price (HBAR) was bearish across February into the first week of March before a bullish resurgence inspired hope among investors. In its recovery attempt, however, HBAR price faced much resistance as overhead pressure built up, and now the Exponential Moving Averages (EMA) have the Hashgraph technology token suppressed.
Hedera Hashgraph price drops amid Binance liquidations
Hedera Hashgraph price is $0.061 at the time of writing, after losing almost 3% in the last 24 hours. Based on CoinMarketCap data, HBAR trading volume is up almost 10%, with Coinalyze showing surging liquidations on the Binance exchange.
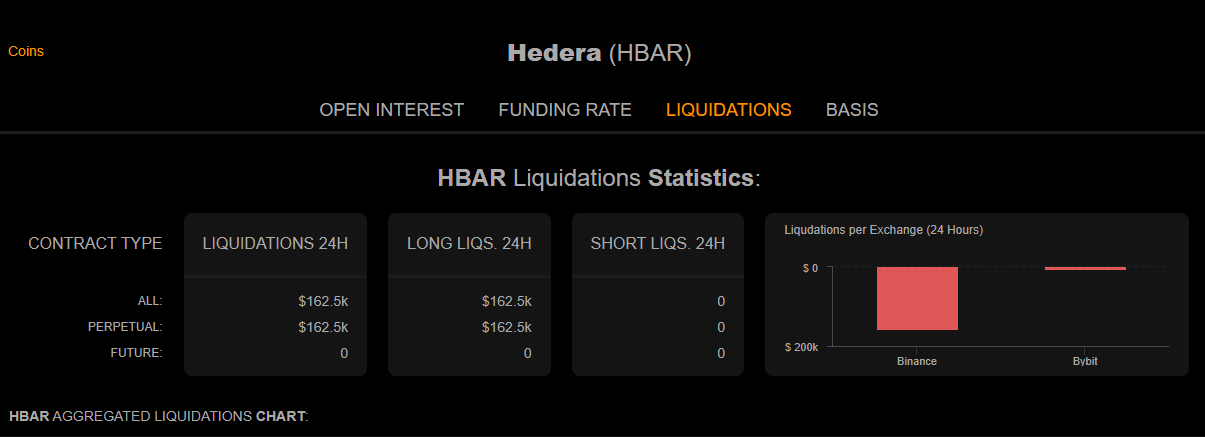
Based on the data, Binance is recording the highest liquidation for HBAR token, which explains the steady decline in Hedera Hashgraph price.
Long liquidation spotted on Binance usdⓢ-m $HBAR.
— CNGG - Liquidation Detector (@LiquDetector) April 20, 2023
$90,146.20$ market sold at 0.06108$. ⬇️
At the time of writing, Coinalyze shows up to 156,790 total liquidations, but the number keeps changing as CoinMonitor recorded 178,500 earlier on Thursday.
$178.5K $HBAR SHORTED @$0.062029 BINANCE SPOT
— TheCoinMonitor (@TheCoinMonitor_) April 20, 2023
Sentiment:
1H: Bullish
Liquidation of an asset defines turning the asset into cash, hence selling. It is a bearish force indicating that Binance is closing traders’ leveraged positions, presumably because they (traders) have insufficient funds to keep a leveraged trade open.
Hedera Hashgraph price could drop 10%
Hedera Hashgraph price could drop an additional 10% if the bearish momentum ensues. Such a move could send HBAR to find support around the $0.057 level. In highly bearish cases, the altcoin could extend a leg down to tag the $0.046 support level, marking a successful retest of the mid-November to mid-December lows.
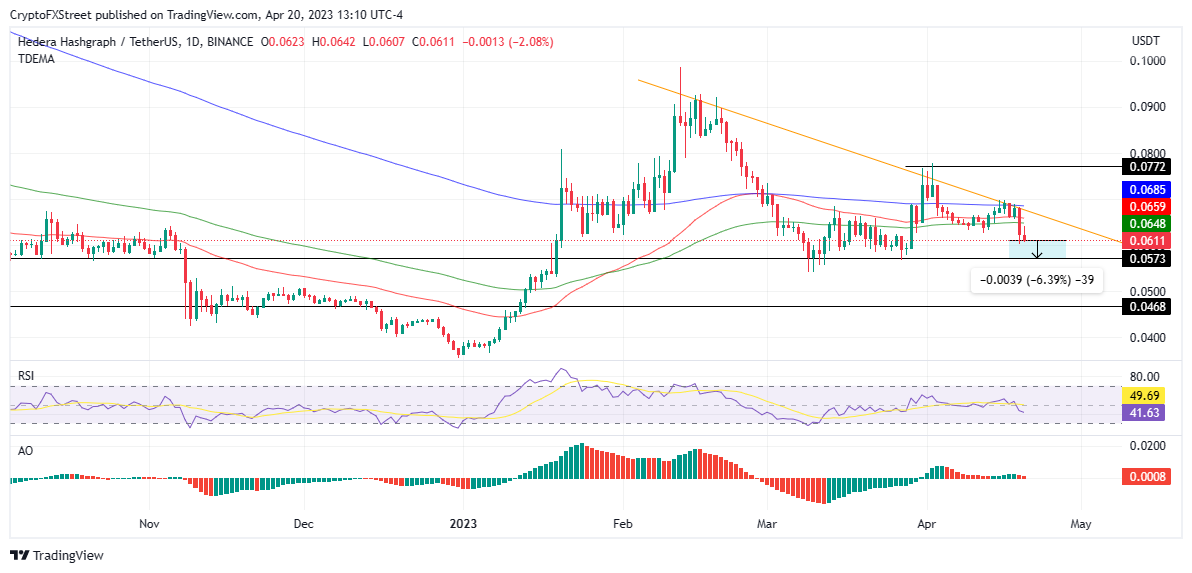
HBAR/USDT 1-day chart
Conversely, if buyer momentum takes form, Hedera Hashgraph price could rise to confront supplier congestion zones due to the 100-, 50-, and 200-day EMAs at $0.064, $0.065, and $0.068 levels, respectively. Notably, the bearish case will be invalidated once HBAR makes a decisive candlestick close above the 200-day EMA, marking a successful escape above the downtrend line.
Above the bearish zone, the Hedera Hashgraph price could extend a neck high to tag the $0.077 resistance level, but this would be in extremely bullish cases. Nevertheless, such a move would denote an uptick of around 25% from the current price of $0.061.
Information on these pages contains forward-looking statements that involve risks and uncertainties. Markets and instruments profiled on this page are for informational purposes only and should not in any way come across as a recommendation to buy or sell in these assets. You should do your own thorough research before making any investment decisions. FXStreet does not in any way guarantee that this information is free from mistakes, errors, or material misstatements. It also does not guarantee that this information is of a timely nature. Investing in Open Markets involves a great deal of risk, including the loss of all or a portion of your investment, as well as emotional distress. All risks, losses and costs associated with investing, including total loss of principal, are your responsibility. The views and opinions expressed in this article are those of the authors and do not necessarily reflect the official policy or position of FXStreet nor its advertisers. The author will not be held responsible for information that is found at the end of links posted on this page.
If not otherwise explicitly mentioned in the body of the article, at the time of writing, the author has no position in any stock mentioned in this article and no business relationship with any company mentioned. The author has not received compensation for writing this article, other than from FXStreet.
FXStreet and the author do not provide personalized recommendations. The author makes no representations as to the accuracy, completeness, or suitability of this information. FXStreet and the author will not be liable for any errors, omissions or any losses, injuries or damages arising from this information and its display or use. Errors and omissions excepted.
The author and FXStreet are not registered investment advisors and nothing in this article is intended to be investment advice.
Recommended Content
Editors’ Picks

Ethereum Price Forecast: ETH consolidates below $2,000 as Standard Chartered alters its prediction for 2025
Ethereum remained just below $2,000 in the Asian session on Tuesday as Standard Chartered's Global Head of Digital Assets Research, Geoffrey Kendrick, updated the bank's 2025 price forecast for ETH.

Solana price faces 50-day resistance as SOL futures debut on CME Group with $5M volume on fifth anniversary
Solana (SOL) stagnated around the $128 mark on Monday despite multiple bullish catalysts. The recent SOL unlocks by Alameda Research, ahead of FTX creditor repayments, have created a persistent bearish overhang since early March.

Canary Capital proposes first-ever Sui ETF following S-1 filing with the SEC
SUI saw slight gains on Monday as Canary Capital submitted an S-1 application with the Securities & Exchange Commission (SEC) to launch a Sui exchange-traded fund (ETF). This adds to the growing list of altcoin ETF filings awaiting approvals from the regulator.

Outflows in crypto funds reach $6.4 billion over five weeks amid long-term holder accumulation
Crypto exchange-traded funds (ETFs) extended their outflow streak last week, totaling $1.7 billion, bringing the total outflows in the past 5 weeks to $6.4 billion, per CoinShares weekly report on Monday.

Bitcoin: BTC at risk of $75,000 reversal as Trump’s trade war overshadows US easing inflation
Bitcoin price remained constrained within a tight 8% channel between $76,000 and $84,472 this week. With conflicting market catalysts preventing prolonged directional swings, here are key factors that moved BTC prices this week, as well as key indicators to watch in the weeks ahead.

The Best brokers to trade EUR/USD
SPONSORED Discover the top brokers for trading EUR/USD in 2025. Our list features brokers with competitive spreads, fast execution, and powerful platforms. Whether you're a beginner or an expert, find the right partner to navigate the dynamic Forex market.