• Google Cloud announced its integration with Band Protocol's Standard Dataset on April 15.
  • Band Protocol price exploded from a low of $17.5 to a new all-time high at $23.3.
  • The partnership aims to provide accurate and reliable price discovery mechanisms.

Band Protocol announced that Google joined the project integrating BAND oracles on Google Cloud. Band Protocol price reacted instantly, jumping by 40% to new all-time highs at $23.3. 

Band Protocol and Google join hands

The official Medium page of Google Cloud released an article explaining the mechanism of Band Protocol and how its integration will help both companies. 

We are proud to announce that Google Cloud has integrated the Band Protocol’s Standard Dataset, live on Google BigQuery, to enable immediate and accurate analysis of financial time series data. With Band Protocol oracles live on BigQuery, this is one of the direct collaborations with the Google Cloud team to enable traditional, hybrid blockchain and cloud applications to be built which use decentralized oracles.

Band Protocol oracles will be fully integrated into Google BigQuery and will help to provide accurate price data to all capital markets. These analytics can also be derived in real-time using Machine Learning, according to Google.

This partnership will help Band Protocol expand its use cases and expand the data available on BandChain even further. The main focus of Band is to allow everyone to use decentralized oracles for any kind of external data.

Band Protocol price explodes but might be poised for a correction

Band Protocol price had a massive 40% explosion thanks to Google Cloud integration news. The digital asset hit a new all-time high at $23.3. This is the only key resistance level ahead. 

A breakout above this point could drive Band Protocol price towards $26.1 at the 123.6% Fibonacci level and as high as $28.31 at the 141.4% level.

band price

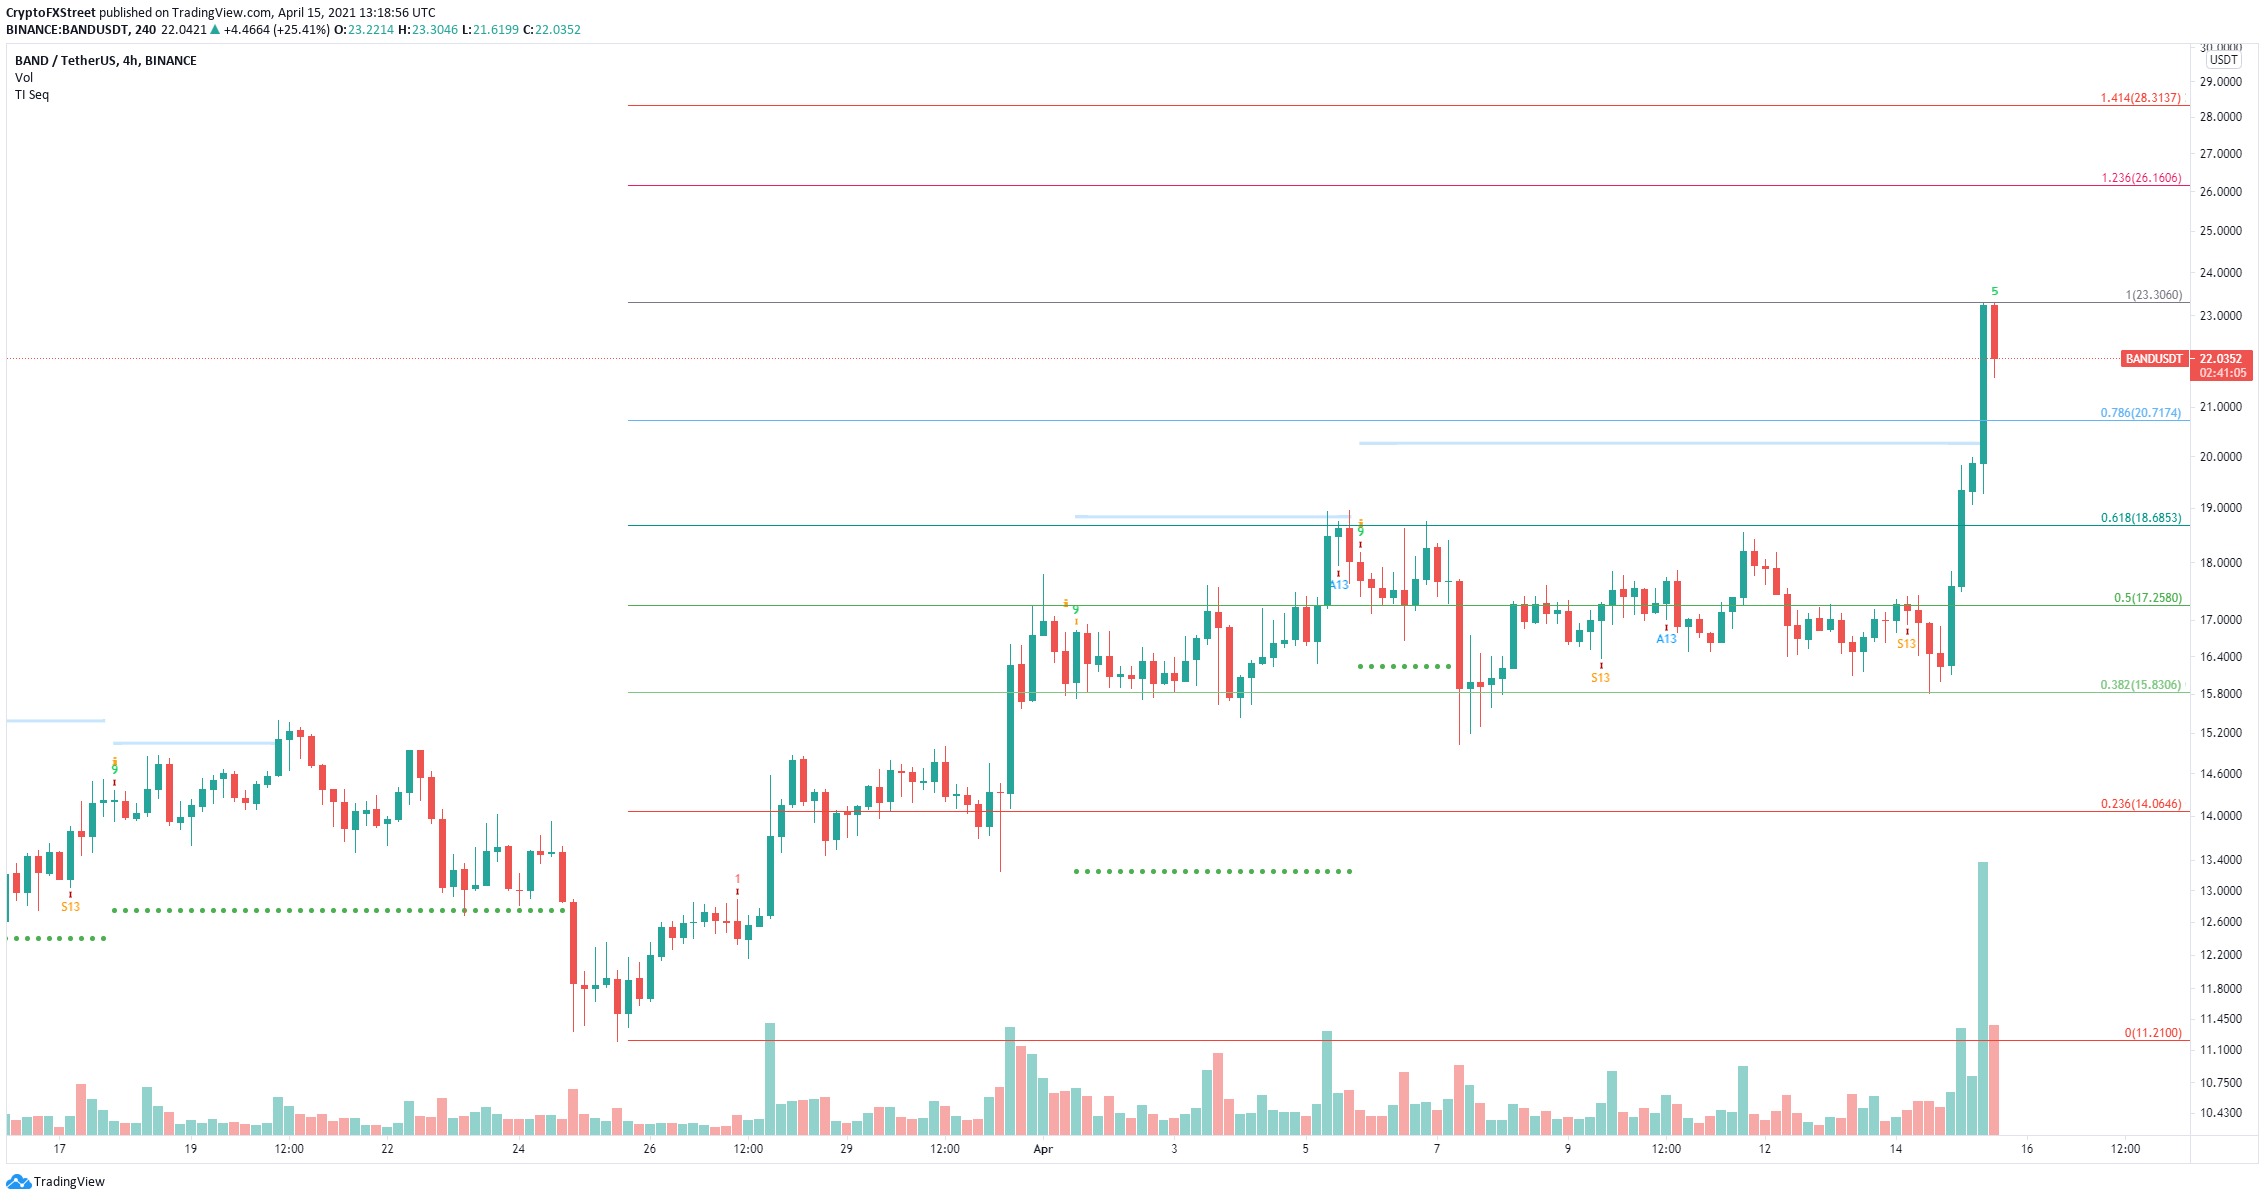
BAND/USD 4-hour chart

However, the MVRV ratio (30d), which shows the average profit or loss of BAND tokens moved in the last 30 days, has spiked significantly above the danger zone, which is around 15% indicating that BAND is poised for a correction. 

band price

BAND MVRV (30d) chart

The most significant support level is $20.71, which is the 78.6% Fibonacci retracement level. A breakdown below this point could push Band Protocol price as low as $18.68 at the 61.8% Fibonacci retracement level. 


Note: All information on this page is subject to change. The use of this website constitutes acceptance of our user agreement. Please read our privacy policy and legal disclaimer. Opinions expressed at FXstreet.com are those of the individual authors and do not necessarily represent the opinion of FXstreet.com or its management. Risk Disclosure: Trading foreign exchange on margin carries a high level of risk, and may not be suitable for all investors. The high degree of leverage can work against you as well as for you. Before deciding to invest in foreign exchange you should carefully consider your investment objectives, level of experience, and risk appetite. The possibility exists that you could sustain a loss of some or all of your initial investment and therefore you should not invest money that you cannot afford to lose. You should be aware of all the risks associated with foreign exchange trading, and seek advice from an independent financial advisor if you have any doubts.

Join Telegram

Recommended content


Recommended Content

Editors’ Picks

Ripple on-chain metrics show bullish signs amidst legal struggle with SEC, XRP eyes recovery

Ripple on-chain metrics show bullish signs amidst legal struggle with SEC, XRP eyes recovery

Ripple made a comeback above $0.48 on Tuesday and hovers above that level in Wednesday’s European session. Ripple on-chain metrics such as transaction volume and Network Realized Profit/Loss have turned bullish, supporting a recovery in the altcoin. 

More Ripple News

Bitcoin price falls amidst German government transfers, miners activity

Bitcoin price falls amidst German government transfers, miners activity

Bitcoin (BTC) extends correction on Wednesday and hovers around $61,000 after finding resistance near the $64,000 level on Monday. Recent on-chain data indicates heightened selling activity from Bitcoin miners early in the week. 

More Bitcoin News

Crypto Today: Bitcoin erases gains from end of June, Ethereum declines while Ripple holds

Crypto Today: Bitcoin erases gains from end of June, Ethereum declines while Ripple holds

Bitcoin wipes out gains from the last week of June and falls below $60,000 on Wednesday. Ethereum and top altcoins ranked by market capitalization erased gains as the inflation outlook worsened. Ripple holds on to recent gains and hovers above $0.48 on Wednesday. 

More Cryptocurrencies News

Three reasons why altcoins could shake off losses this week

Three reasons why altcoins could shake off losses this week

On-chain data from Santiment shows that altcoins are currently in the opportunity zone, or generating buy signals. The top three altcoins in the buy zone are Basic Attention Token (BAT), Chromia (CHR), and Highstreet (HIGH), per Santiment. 

More Altcoins News

Bitcoin: BTC price correction could end in July, according to seasonal data

Bitcoin: BTC price correction could end in July, according to seasonal data

Bitcoin (BTC) price appears poised for a decline this week, influenced by slight outflows in US spot ETFs, selling activity among BTC miners, and a combined transfer of 4,690.28 BTC to centralized exchanges by the US and German governments.

Read full analysis

BTC

ETH

XRP