|

GMX price could make a 50% climb as GMX’s daily chart is governed by a bullish pattern

  • GMX price has formed an inverse head and shoulder pattern on the daily timeframe.
  • GMX could make a 49% climb if the price manages a daily candlestick close above $59.64 bullish.
  • A break and close below $50.00 would invalidate the bullish thesis.

GMX (GMX) price has been trading within a range for months, forming a series of higher highs and then higher lows, culminating in an inverse head and shoulder pattern. This is a reversal pattern where two higher lows (shoulders) form on either side of a lower peak (head) in price action in the middle.

Also Read: Three sectors that could thrive as 2024 bull market warms up

GMX could make a 50% climb

The target of an inverse head and shoulder pattern is estimated by measuring the distance between the foot of the pattern to the peak of the head. This vertical distance is then superimposed at the breakout point.

If the GMX price manages a break and closes above $59.64, it could activate the governing chart pattern, with the altcoin likely to shoot 49.03% to $89.00. In a highly bullish case, the gains could extend for GMX to reclaim the $91.40 range high, levels last seen on April 18, 2023.

Notice the trajectory of the Relative Strength Index (RSI), suggesting momentum is still rising. The Awesome Oscillator (AO) indicator is also in positive territory with green histogram bars, suggesting a strong presence of the bulls in the GMX market.

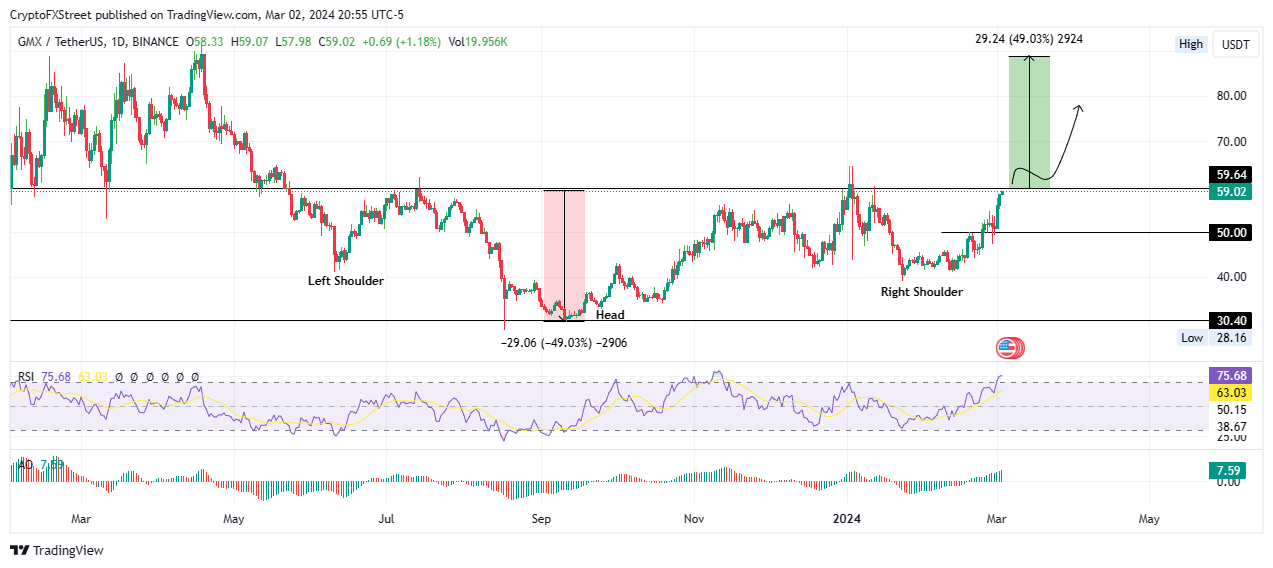
GMX/USDT 1-day chart

On the other hand, a rejection from $59.64 could send GMX price south, likely to retest the $50.00 psychological support. A break and close below this level would produce a lower low, making leeway for the bears to recover the market. 

Author

Lockridge Okoth

Lockridge is a believer in the transformative power of crypto and the blockchain industry.

More from Lockridge Okoth
Share:

Editor's Picks

Hyperliquid Price Forecast: HYPE rises on commodities demand amid US-Iran war

Hyperliquid (HYPE) steadies above $33 at press time on Tuesday, marking its fourth consecutive day of recovery in a broadly volatile market due to the ongoing US-Israel strikes on Iran.

Stellar Price Forecast: XLM risks deeper losses as derivatives metrics turn negative

Stellar is trading red below $0.16 at the time of writing, after a slight recovery the previous day. Weakening derivatives data caps the recovery, while an unfavorable technical outlook projects a deeper correction for the XLM token in the upcoming days.

Aave Price Forecast: AAVE tests channel resistance as ParaFi Capital deposit, bearish derivatives data caps upside

Aave (AAVE) trades around $120 on Tuesday, testing the channel resistance, signaling that sellers remain active in the zone. Lookonchain data shows that ParaFi Capital transferred 42,000 AAVE tokens to Coinbase Prime over the past 10 hours, often interpreted as a potential selling signal.

CME Group's futures suite now covers over 75% of total crypto market cap

CME Group announced that its crypto futures offering now covers over 75% of the total digital asset market cap, following the launch of its Cardano (ADA), Chainlink (LINK) and Stellar (XLM) products.

Bitcoin Price Annual Forecast: BTC holds long-term bullish structure heading into 2026

Bitcoin (BTC) is wrapping up 2025 as one of its most eventful years, defined by unprecedented institutional participation, major regulatory developments, and extreme price volatility.

Bitcoin: Another month of losses, and it’s been five

Bitcoin (BTC) price is stabilizing around $68,000 at the time of writing on Friday, but the Crypto King is poised to close February on a fragile footing, marking its fifth consecutive month of losses since October and a rare start to the year with back-to-back monthly corrections.