FTT holders maintain optimism despite FTX creditors' burst bubble
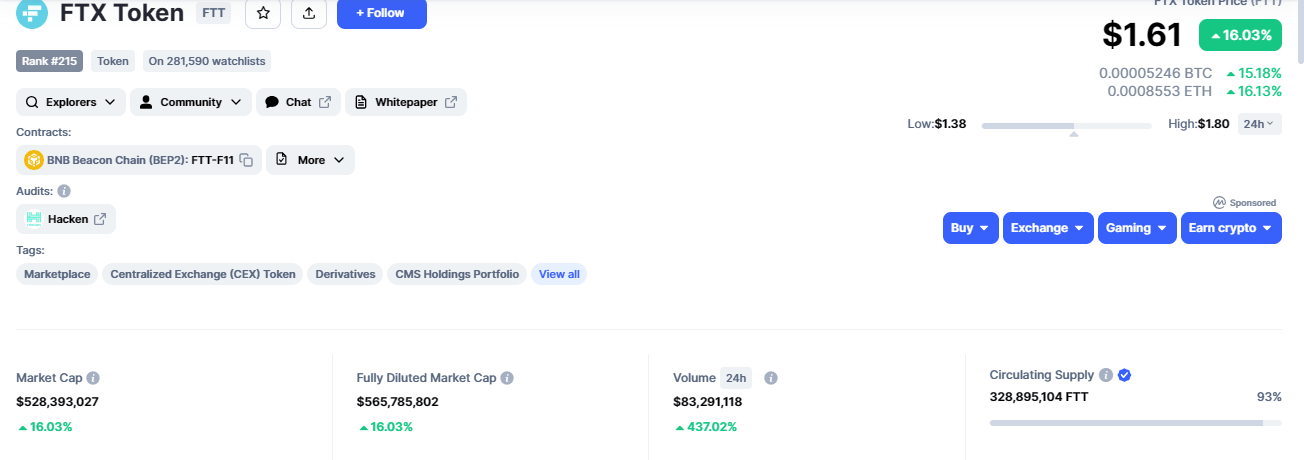
- FTX token price is up almost 20% alongside a 24-hour trading volume surge of around 430%.
- The rally comes despite the epic collapse of the network’s customer claims portal, which was only alive for an hour post-launch.
- The product collapsed due to site overload as FTX creditors, individual & institutional alike, sought to potentially recover their crypto.

FTT, the ticker for the FTX ecosystem, is posting commendable statistics on CoinMarketCap, considering the current lull in the crypto market. The token is attempting a recovery after a load-shedding exercise that began in late June, sending the altcoin down thirtyfold.
Also Read: Bitcoin price heedless as institutions that know markets better than anybody wager on BTC mining
FTT token defies network woes
FTT token remains bullish, rising almost 20% in the last 24 hours. The optimism has catapulted the cryptocurrency’s market cap by 16% as investors saw renewed hope on July 11. Based on a recent announcement by Sunil, the FTX ecosystem had finally unveiled the means through which customers that suffered exposure would be made whole again.
Customer Claims portal is live https://t.co/ymtbrvT3eF
— Sunil (FTX 2.0 Champion) (@sunil_trades) July 11, 2023
Select platform to proceed: https://t.co/vW9S9i3Cxy , https://t.co/gZZ85SJX7r, Blockfolio, FTX EU, FTX JP, Liquid pic.twitter.com/Crhe8lMNhp
Sunil, going by @sunil_trades on Twitter, is a confirmed FTX creditor activist touted as the champion for the ecosystem’s do-over, FTX2.0. His announcement was well received, provoking hype among community members as both individual and institutional users finally envisioned a recovery for financial losses made in November 2022 when crypto exchange FTX imploded following the unscrupulous management of Sam Bankman-Fried, who commingled customer funds trying to rescue his Alameda Research.
2/
— Axel Bitblaze (@Axel_bitblaze69) July 11, 2023
Wondering what happened to FTX?
Well, let me give you a quick recap. FTX, once a big crypto exchange, experienced a sudden collapse in late 2022.
The mastermind behind it all, @SBF_FTX, was caught using customer deposits to patch up the holes in Alameda Research pic.twitter.com/dpCClWKzap
Unfortunately, the celebration was short-lived after the portal collapsed barely an hour post-launch, with Sunil citing temporary network overload.
Down temporarily as overloaded
— Sunil (FTX 2.0 Champion) (@sunil_trades) July 11, 2023
As of press time, the portal remains inactive.
FTT camp remains optimistic
While the recovery bubble burst too soon for FTT community members, the hope remains alive, possibly because they cling to the promise of complete reimbursement before September 29, 2023. Nevertheless, it appears that the crash only affected FTX.com customers as FTX EU managed to recover their funds.
Very few people were registered if FTX EU and they have been able to withdraw funds already. You are likely to be with https://t.co/vW9S9i3Cxy . Try your password and you will be able to log in with the correct one
— Sunil (FTX 2.0 Champion) (@sunil_trades) July 11, 2023
Evidence of optimism is indicated in the asset’s trading volume, up 436% at the time of writing. An increase in trading volume suggests more FTT tokens continue exchanging hands. Considering the 16% increase in price over the same timeframe, buying pressure is increasing.
This suggests investors remain optimistic about the token despite the November disappointment. Santiment data corroborates this, with the number of active addresses over the past 24 hours recording a 151% increase.
If buyer momentum increases, the FTX token price could increase further to reclaim the late June highs of around $2.056. Such a move would denote a 30% increase.
The Relative Strength Index (RSI) and Awesome Oscillator (AO) were above their midlines, suggesting bulls headed the FTT market.
FTT/USDT 1-Day Chart
Conversely, with the RSI flattening out and the AO histograms reducing in volume, bears could take advantage of the momentary lapse in buying activity to recover control. The onus is on FTT bulls to defend above the 100- and 50-day Exponential Moving Averages (EMA) support at $1.465 and $1.303 at all odds. A daily candlestick close below the 50-day EMA would invalidate the bullish thesis.
Like this article? Help us with some feedback by answering this survey:
Author

Lockridge Okoth
FXStreet
Lockridge is a believer in the transformative power of crypto and the blockchain industry.


%2520%5B03.03.03%2C%252012%2520Jul%2C%25202023%5D-638247185452982312.png&w=1536&q=95)


