Four ways investors use support and resistance levels to make better trades

Trading should just be a simple process of buying low and selling high but for many investors the process is more akin to rocket science. One of the most basic and easy-to-understand strategies that can help accomplish this is to identify an asset’s support and resistance levels.
Once traders can spot the support and resistance levels, they can improve their entry and exit timing in the market. Support and resistances are also helpful during bullish, bearish and range-bound markets.
Let’s take a moment to understand the basics.
What are supports?
Support is formed at a level where the demand from the buyers absorbs the supply from sellers, preventing the price from declining further. At this level, the bullish traders are inclined to buy as they believe the price is attractive enough and may not decline further.
On the other hand, the bears stop selling because they believe the market has fallen enough and may be due for a rebound. When both these situations occur, a support is formed.
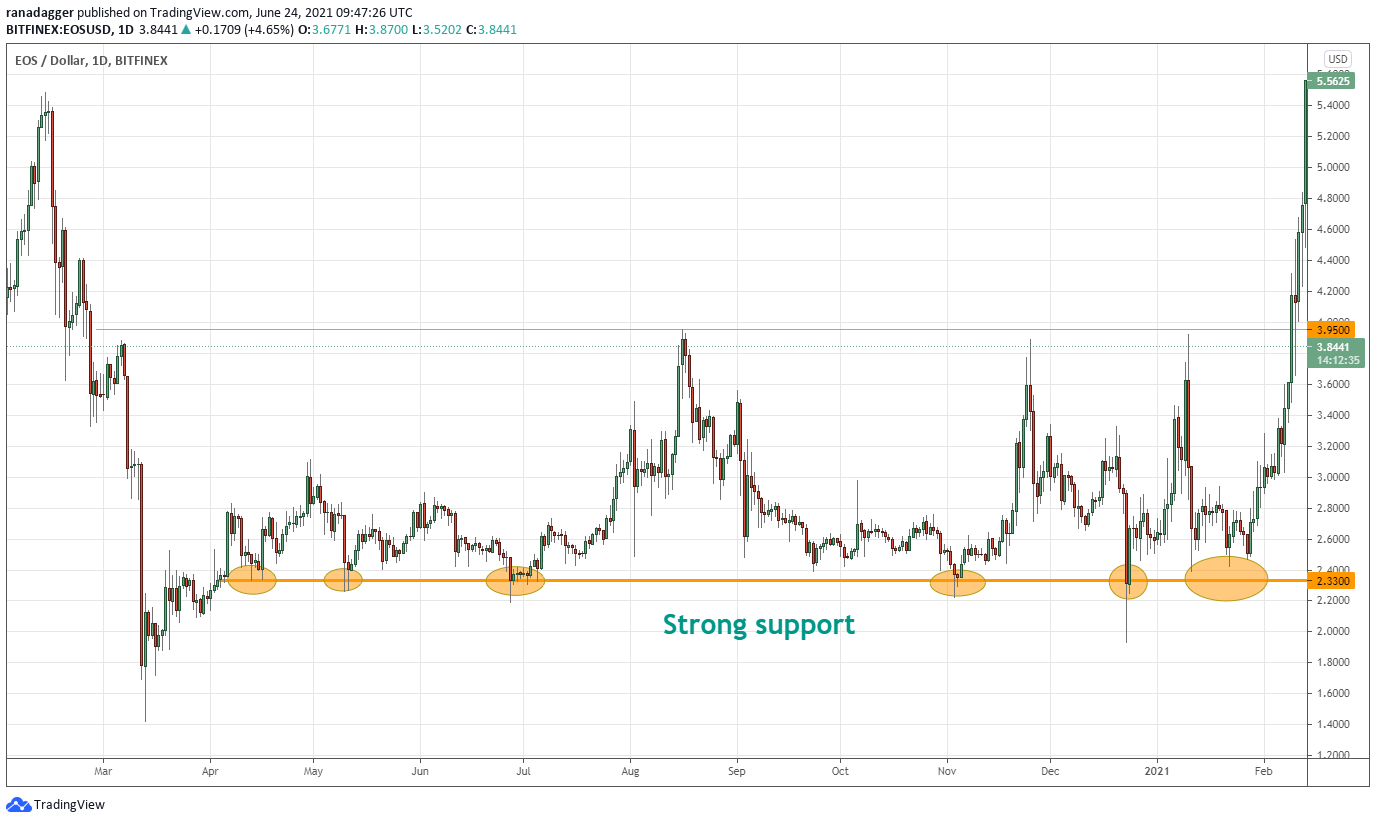
EOS/USD daily chart. Source: TradingView
The above chart is a good example of a strong support. Every time EOS price drops to the $2.33 level, buyers emerge and the selling reduces. This causes demand to exceed supply, resulting in a rebound.
Although horizontal supports are considered to be more reliable, they are not the only way supports are formed. During uptrends, trendlines act as supports.
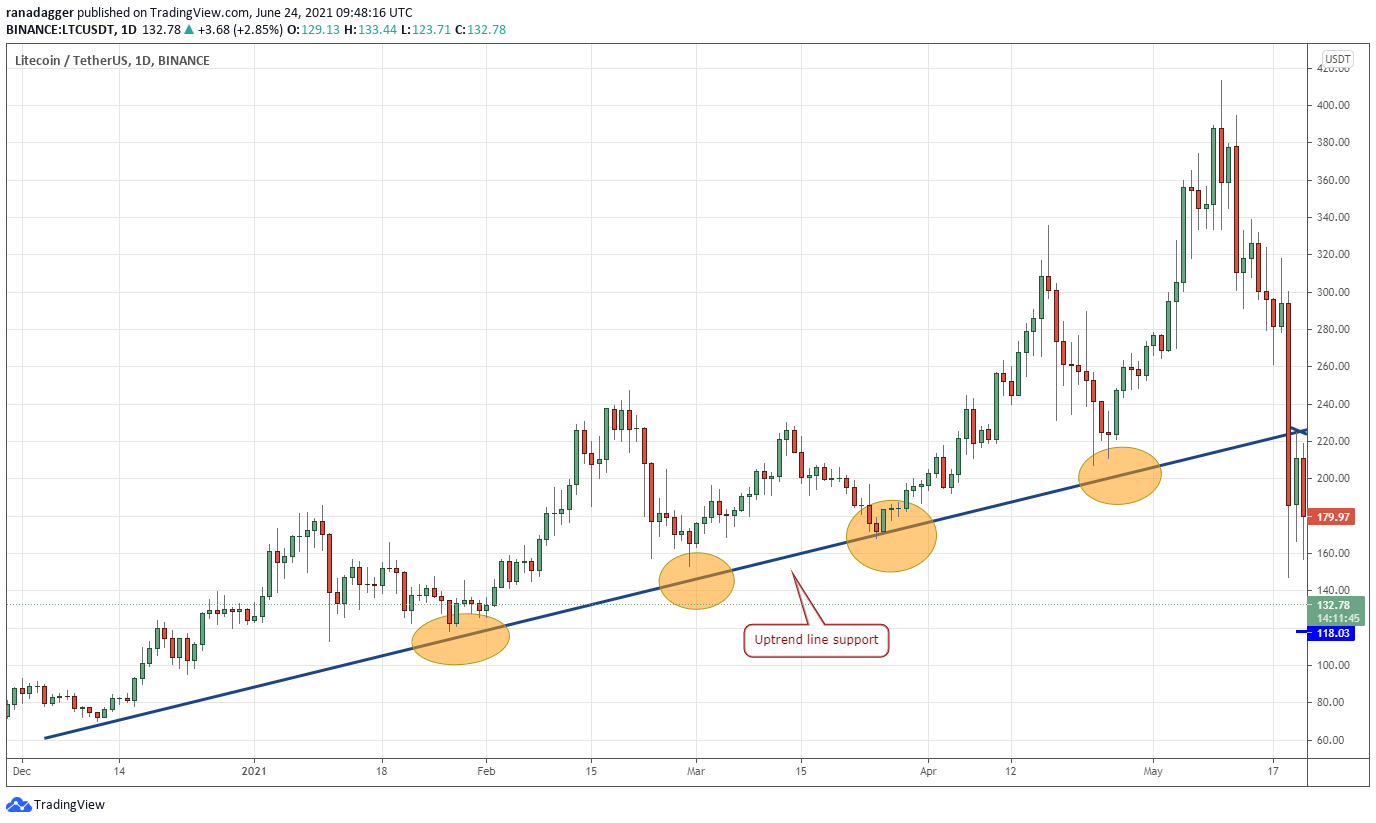
LTC/USDT daily chart. Source: TradingView
Litecoin (LTC) started its bull run in December of 2020. Thereafter, the price rebounded off the trendline on several occasions. This happened because when the price neared the trendline, the bulls purchased, believing that the LTC/USDT pair had reached attractive levels to buy.
At the same time, the counter-trend traders stopped selling, assuming that the near-term may be oversold. Both these occurring at the same time caused the correction to end and the uptrend to resume.
What are resistance levels?
Resistance can be considered as the opposite of support because it is the level where supply exceeds demand, halting the up-move.
The resistance is formed when buyers who have purchased at lower levels start to book profits and the aggressive bears start shorting as they believe the rally is extended and ready for a pullback. When supply exceeds demand, the rally stalls and reverses.
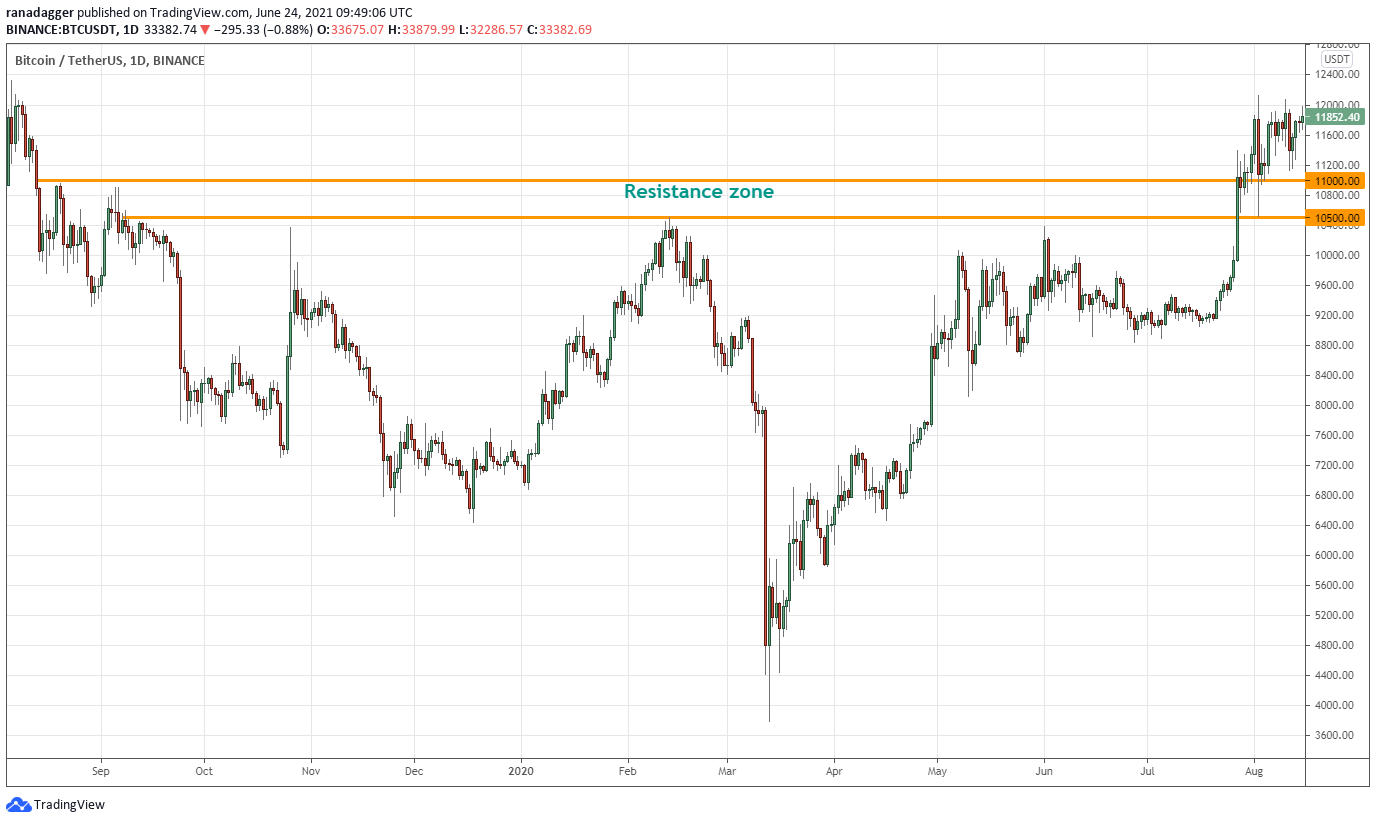
BTC/USDT daily chart. Source: TradingView
The support or resistance does not need to be a single level. The above chart shows how the area between $10,500 to $11,000 acted as the resistance zone. Whenever the price reached this zone, short-term traders booked profits and aggressive bears shorted the BTC/USDT pair. Between August 2019 and July 2020, the pair turned down from the resistance zone on five occasions.
Similar to support, the resistance line or zone does not need to always be horizontal.
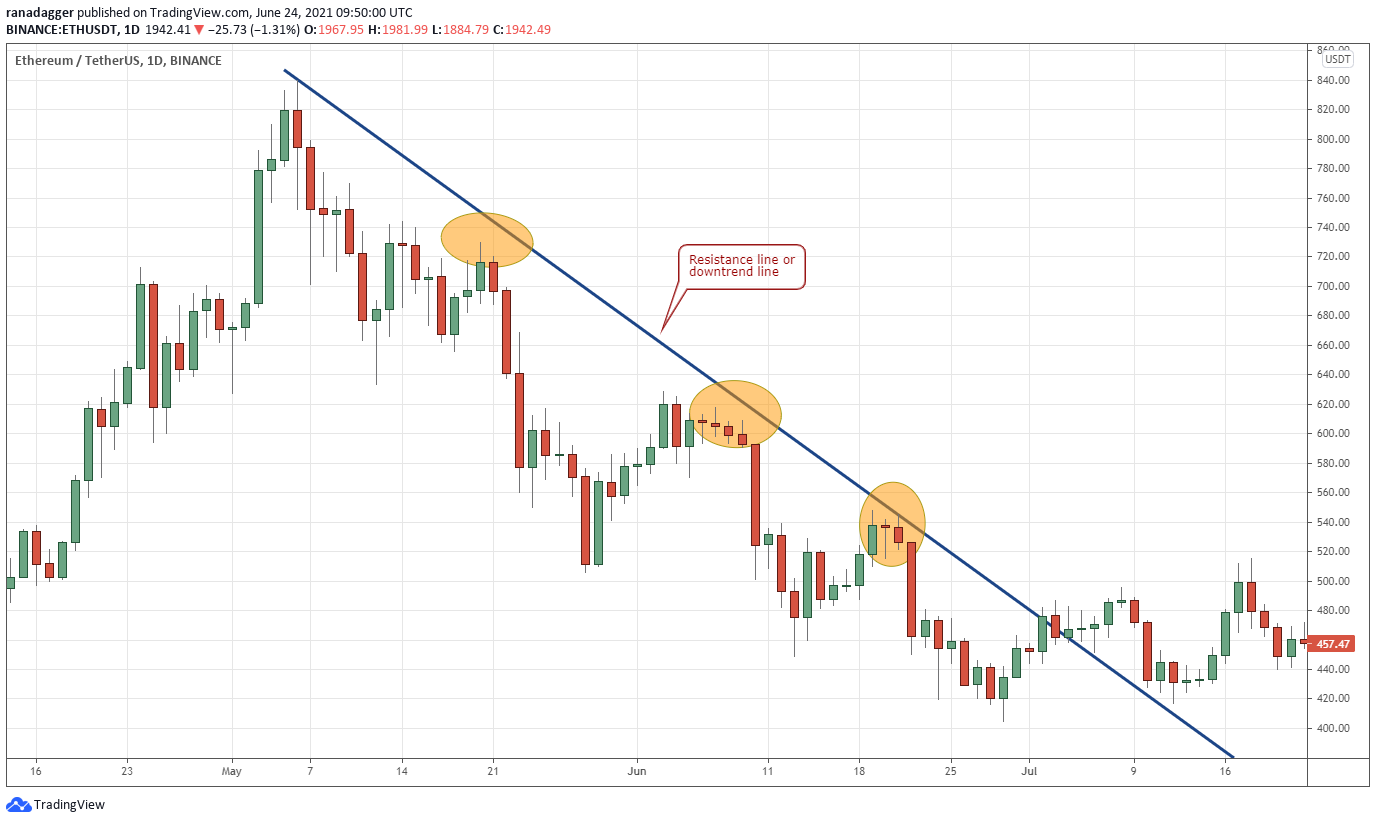
ETH/USDT daily chart. Source: TradingView
During the decline from May 6, 2018, to July 4, 2018, Ether (ETH) rallied to the resistance line, also called the downtrend line, but turned down from there. This is because traders who had a bearish outlook used the rallies to initiate fresh short positions as they anticipated lower levels.
At the same time, aggressive bulls who purchased on sharp dips closed their positions near the resistance line. Hence, the line acted as a wall and the price turned down from it.
Identifying support and resistance during consolidation phases
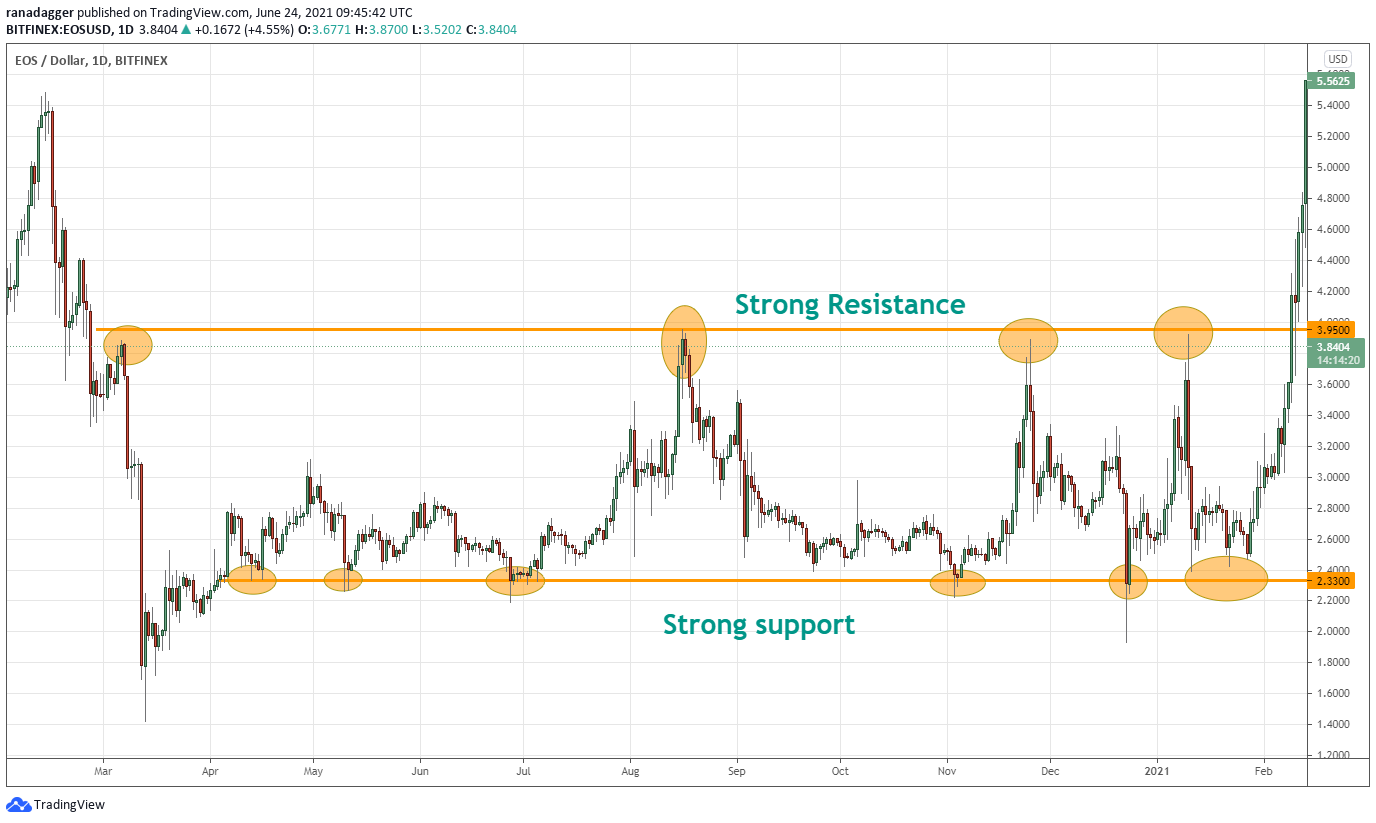
EOS/USD daily chart. Source: TradingView
When the support and resistance are clearly defined as in the EOS/USD pair above, traders can buy on a rebound off the support and wait for the price to rally near the resistance to close the position. The stop-loss for the trade can be kept just below the support of the range.
Several times, professional traders may try to hunt these stops by pulling the price below the support of the range. Therefore, traders may buy on the way up and also wait for the price to close decisively below the support before dumping their positions.
Trading supports in an uptrend
When an asset takes support on an uptrend line three times, traders may expect the line to hold. Hence, long positions can be taken on a bounce off the uptrend line. The stops for the trade can be kept just below the trendline.
However, in an uptrend, the break below the trendline does not necessarily mean that the trend has reversed. Many times, the trend just takes a break before resuming again.
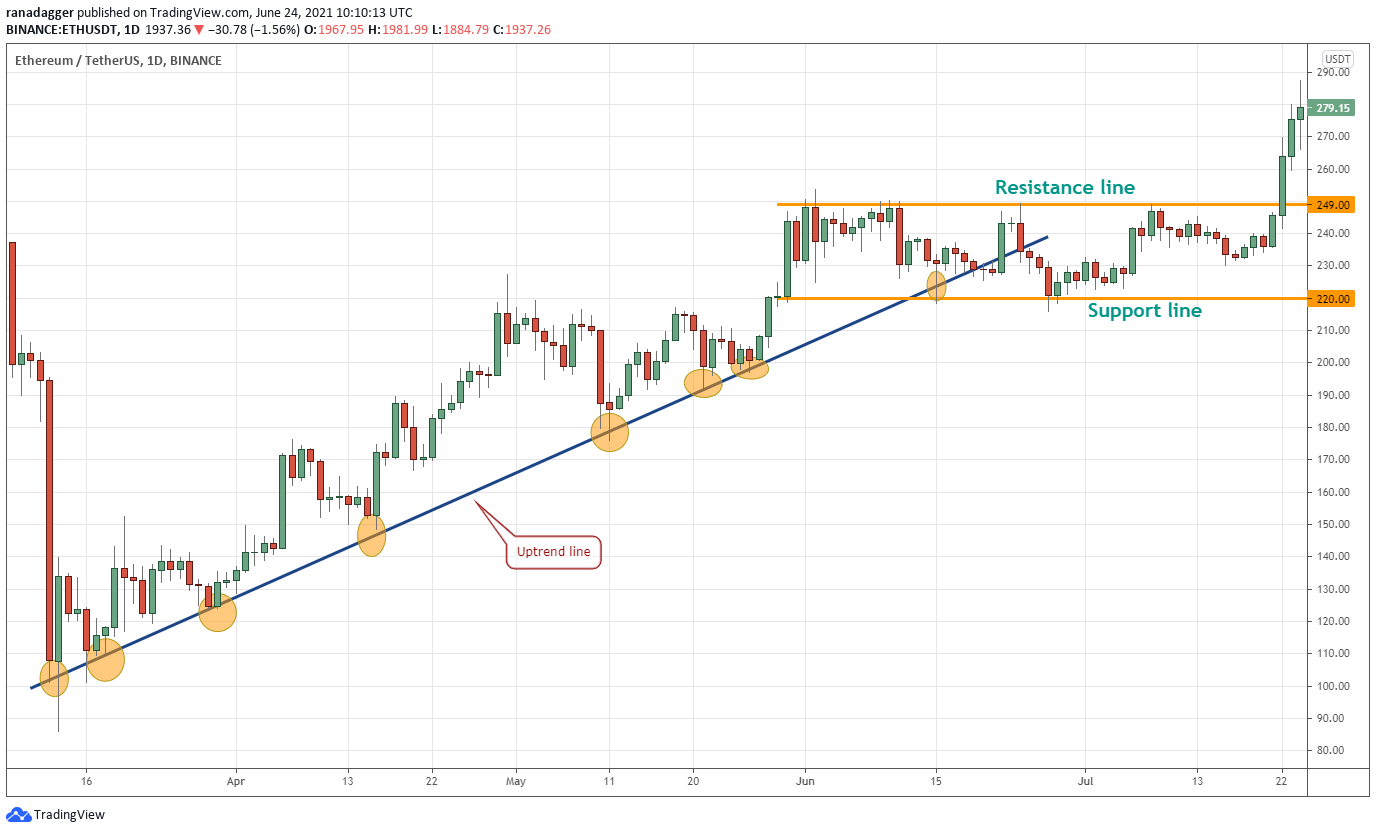
ETH/USDT daily chart. Source: TradingView
As seen in the chart above, the ETH/USDT pair took support on the uptrend line on several occasions. However, when the pair broke below the uptrend line, it did not start a new downtrend. The price consolidated in a range for a few days before resuming the up-move.
Traders may close their long positions if the price dips and sustains below the uptrend line but new short positions should be avoided. If the price resumes its uptrend after consolidation, traders may again look for buying opportunities.
Resistance flips to support
When the price breaks out of a resistance, the bulls try to flip the previous resistance into support. If that happens, a new uptrend begins or resumes. If this happens several times, it may offer a good buying opportunity.
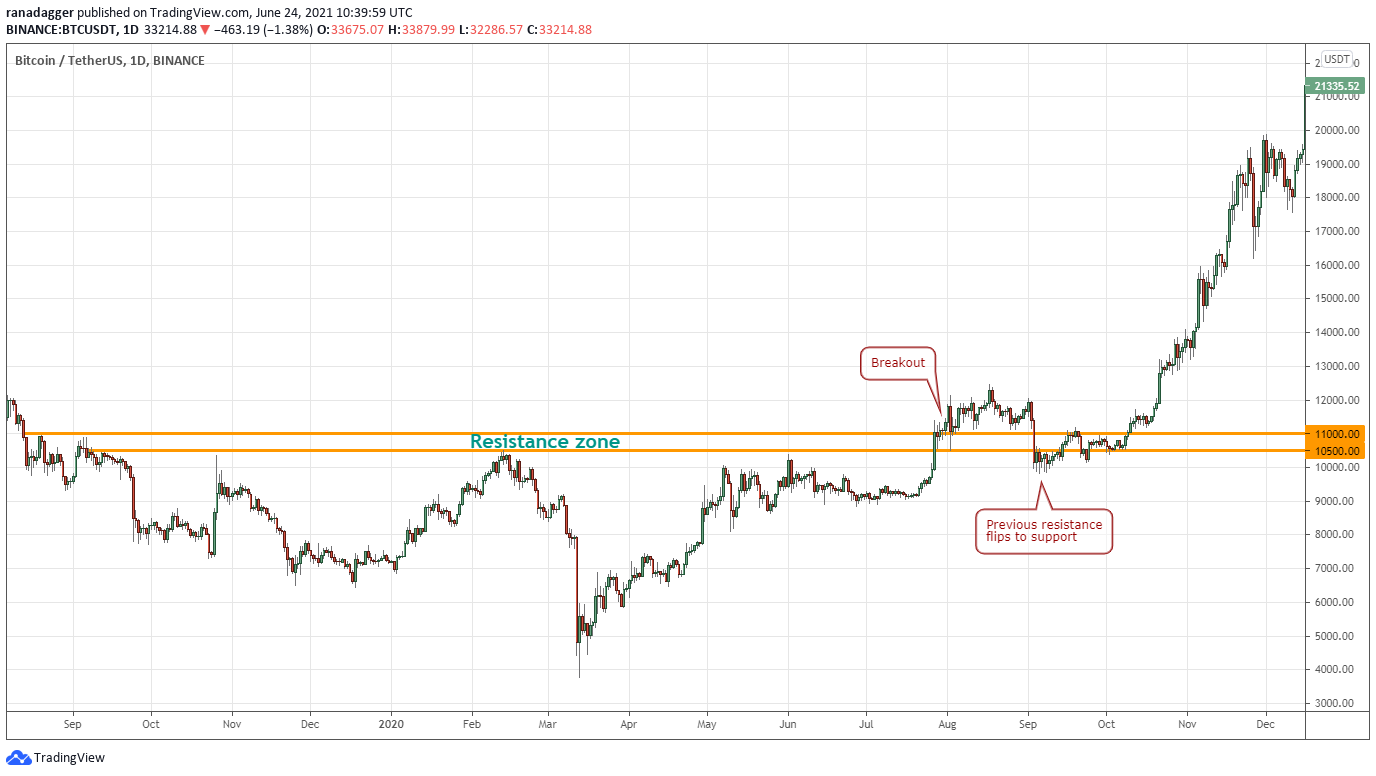
BTC/USDT daily chart. Source: TradingView
Bitcoin was stuck between the $10,500 to $11,000 zone from August 2019 to July 2020. After the breakout from the resistance zone, the price again dropped below $10,500, but the bulls bought the dip aggressively, flipping the level into support. This offered a good buying opportunity to traders as the new uptrend was just getting started.
Support flips to resistance
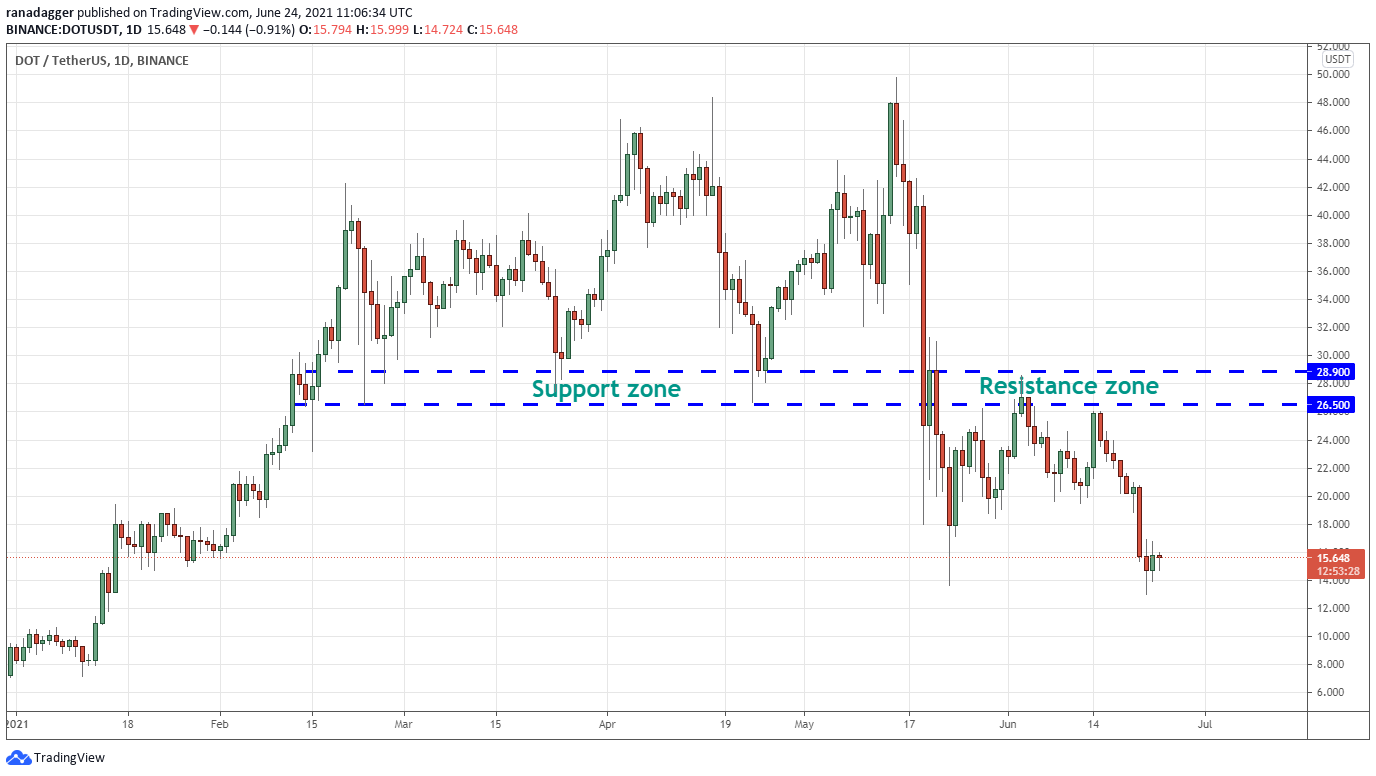
DOT/USDT daily chart. Source: TradingView
Polkadot’s (DOT) chart above shows how the zone between $28.90 to $26.50 was acting as a support zone from Feb. 14 to May 18 of this year. However, once the bears pulled the price below the support zone, the zone flipped over into resistance and has not allowed the price to break above it since then. This is an instance where a support zone turned into a resistance.
Key takeaways
While analyzing any coin, traders must look for support and resistance levels as they can act as good entry and exit opportunities.
In an uptrend, traders should look to buy at support levels and in a downtrend, traders should look to short at the resistance line.
Support and resistance levels are not set in stone and professional traders will try to hunt for stop orders. Hence, traders should keep the stops such that they do not get run down by the market makers.
Author

Cointelegraph Team
Cointelegraph
We are privileged enough to work with the best and brightest in Bitcoin.


