Four reasons why MATIC price will skyrocket by nearly 100%
- MATIC price is forming an inverse head-and-shoulders pattern, which forecasts a 93% upswing.
- The Total Value Locked in Polygon has surpassed that of Solana and could surpass Binance.
- On-chain metrics reveal a favorable picture that adds tailwinds to the technical perspective’s bullish outlook.

MATIC price experienced exponential growth during the 2021 bull run. However, as Bitcoin and the cryptocurrency market collapsed, so did the market value of Polygon. From July 20 to August 8, MATIC witnessed another relatively minor yet exponential increase of a larger move.
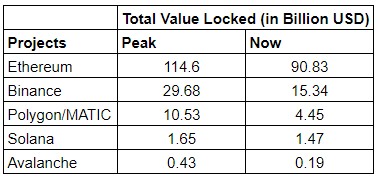
Total value locked continues to climb
Polygon was the underdog for the first half of the 2021 bull run. As time passed, more investors within the space realized what Polygon had to offer as a Layer 2 scaling solution and rushed to purchase MATIC tokens, which resulted in an exponential growth of its market value.
Since January 2021, MATIC price has risen 15,094%, which serves as a proxy for investors’ interest. While tracking price is not the best metric, the total value locked (TVL) can provide a relatively better understanding.
The TVL for MATIC hovers around $4.45 billion. Although this number is nowhere near Ethereum’s, which is $90.83 billion, it is relatively close to taking a jab at Binance’s TVL, $15.34 billion. Interestingly, Polygon has surpassed Solana, which stands at $1.47 billion and $0.19 billion for Avalanche.
MATIC TVL chart
The sudden uptick in TVL comes as popular DeFi blockchains like Aave and Sushi are continuing to embrace Polygon due to its scaling solution capabilities.
Investors prefer MATIC over Binance
Further supporting a steady climb in TVL for Polygon is the growth of the Daily Active Addresses (DAA) metric. The DAA for Polygon increased from 487 on January 1 to 4,396 currently, an 803% increase. Binance’s DAA increased only 171% over the same period from 10,503 to 28,417.
The contrast in the relative increase in the daily active addresses points to the fact that users interacting with DeFi blockchains are drawn more to the MATIC network than Binance.
-637640970293173863.png)
MATIC Binance Coin DAA chart
If this trend keeps up, it is more than likely that Polygon’s TVL will increase and even overtake Binance’s during the next bull run. This theoretical increase would also be able to push MATIC prices up exponentially.
Technicals warn of explosive price action
MATIC price formed an inverse head-and-shoulders pattern between June 24 to August 9. This technical setup contains three distinctive valleys. The one in the middle is typically deeper than the other two and forms the head. The slightly lower valleys of almost equal height create the shoulders, hence the namesake head and shoulders.
Connecting the series of highs shows a resistance barrier known as the “neckline.” Polygon is yet to slice through this supply level at $1.20, which will signal a breakout and the start of a new uptrend.
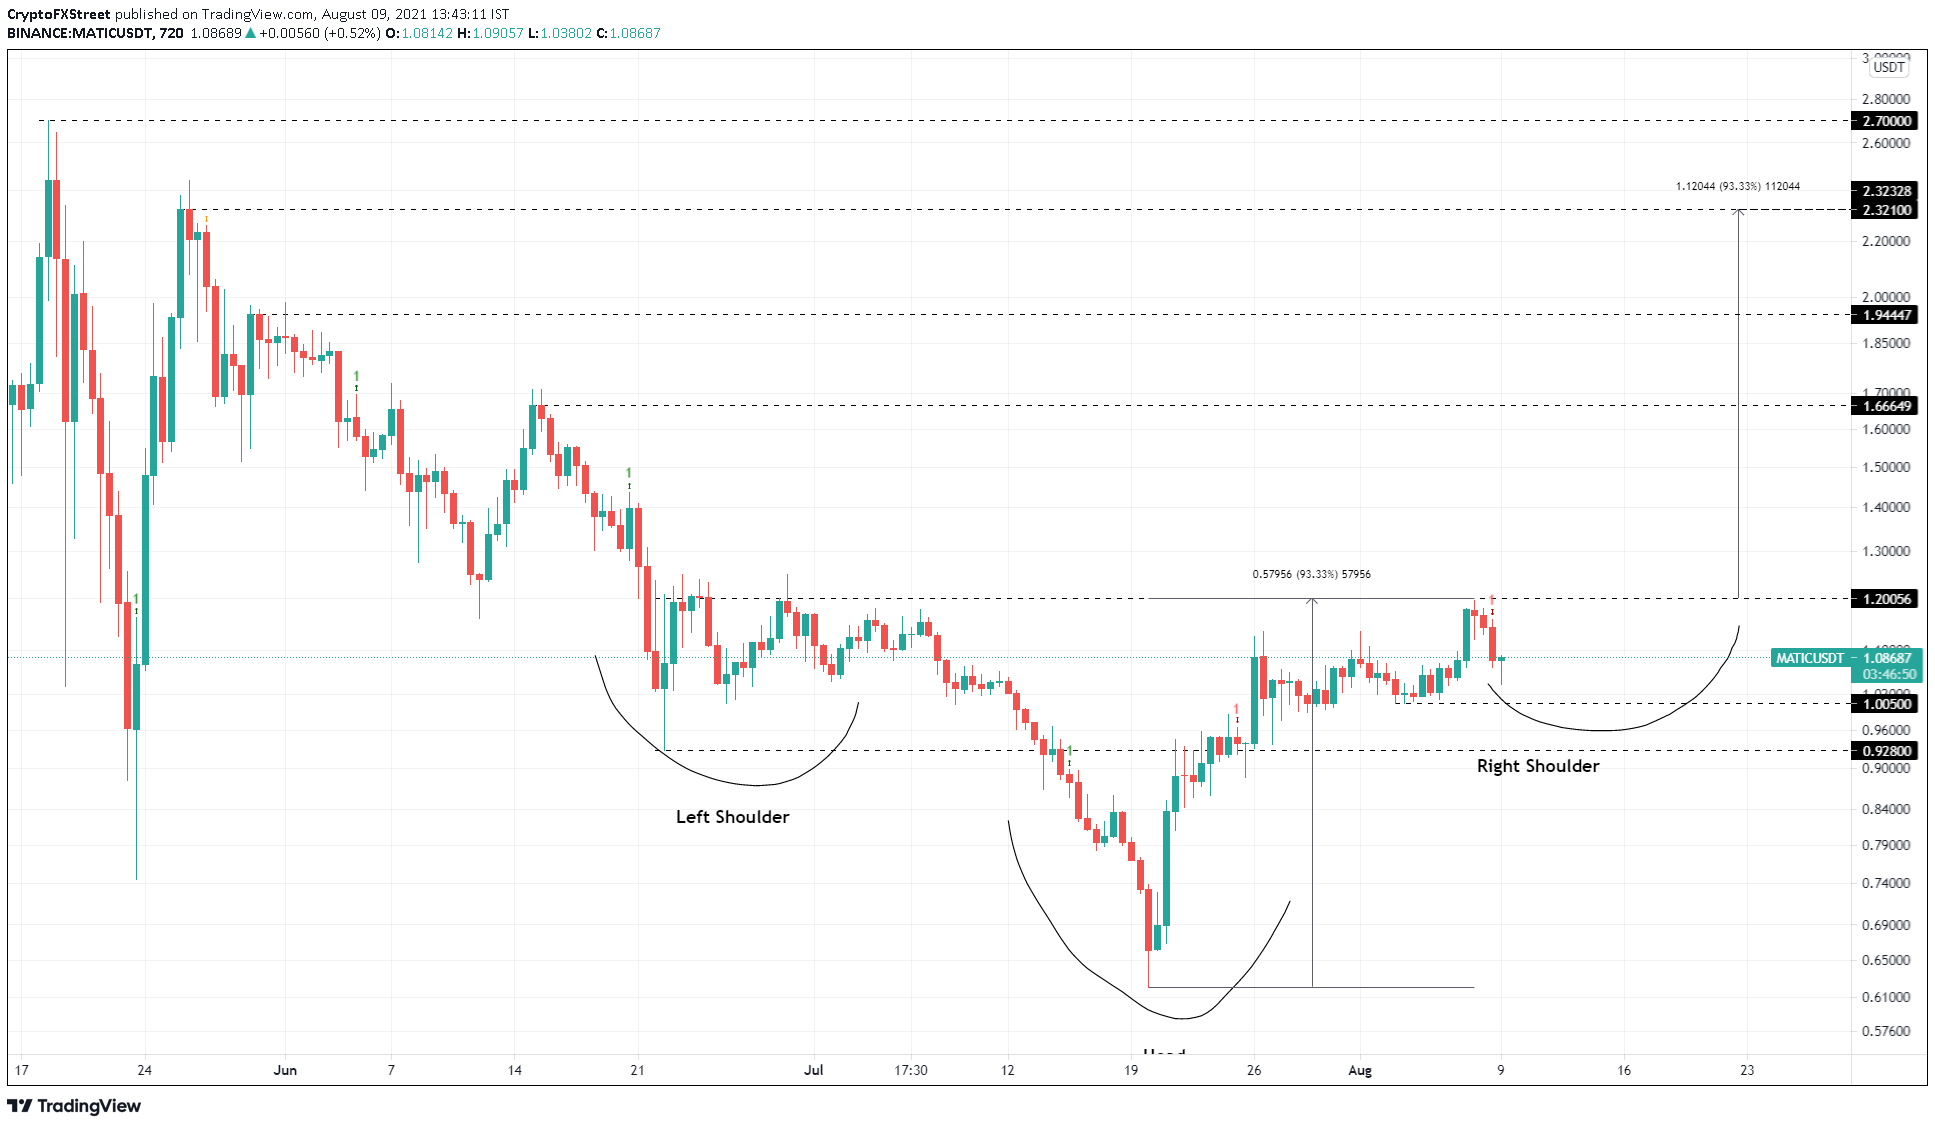
MATIC/USDT 12-hour chart
This technical formation forecasts a 93% upswing, the distance between the head’s lowest point and the neckline added to the breakout point.
Assuming the bulls push MATIC price to shatter the neckline at $1.20 to produce a decisive 12-hour candlestick close above it, it will indicate the start of a new uptrend to $2.32. However, this run-up will not be a cakewalk. The resistance levels at $1.66 and $1.94 will play a pivotal role in hindering the upswing. Therefore, investors need to watch out for a swift move above these barriers to continue the ascent.
Supply shock on centralized entities and lack of resistance levels
Supporting the technical’s bullish outlook is the reduction in the number of MATIC tokens held on exchanges from 1.414 billion to 146 million. This 90% reduction indicates that investors are moving their holdings off centralized entities, revealing that they are confident in MATIC price performance in the near future.
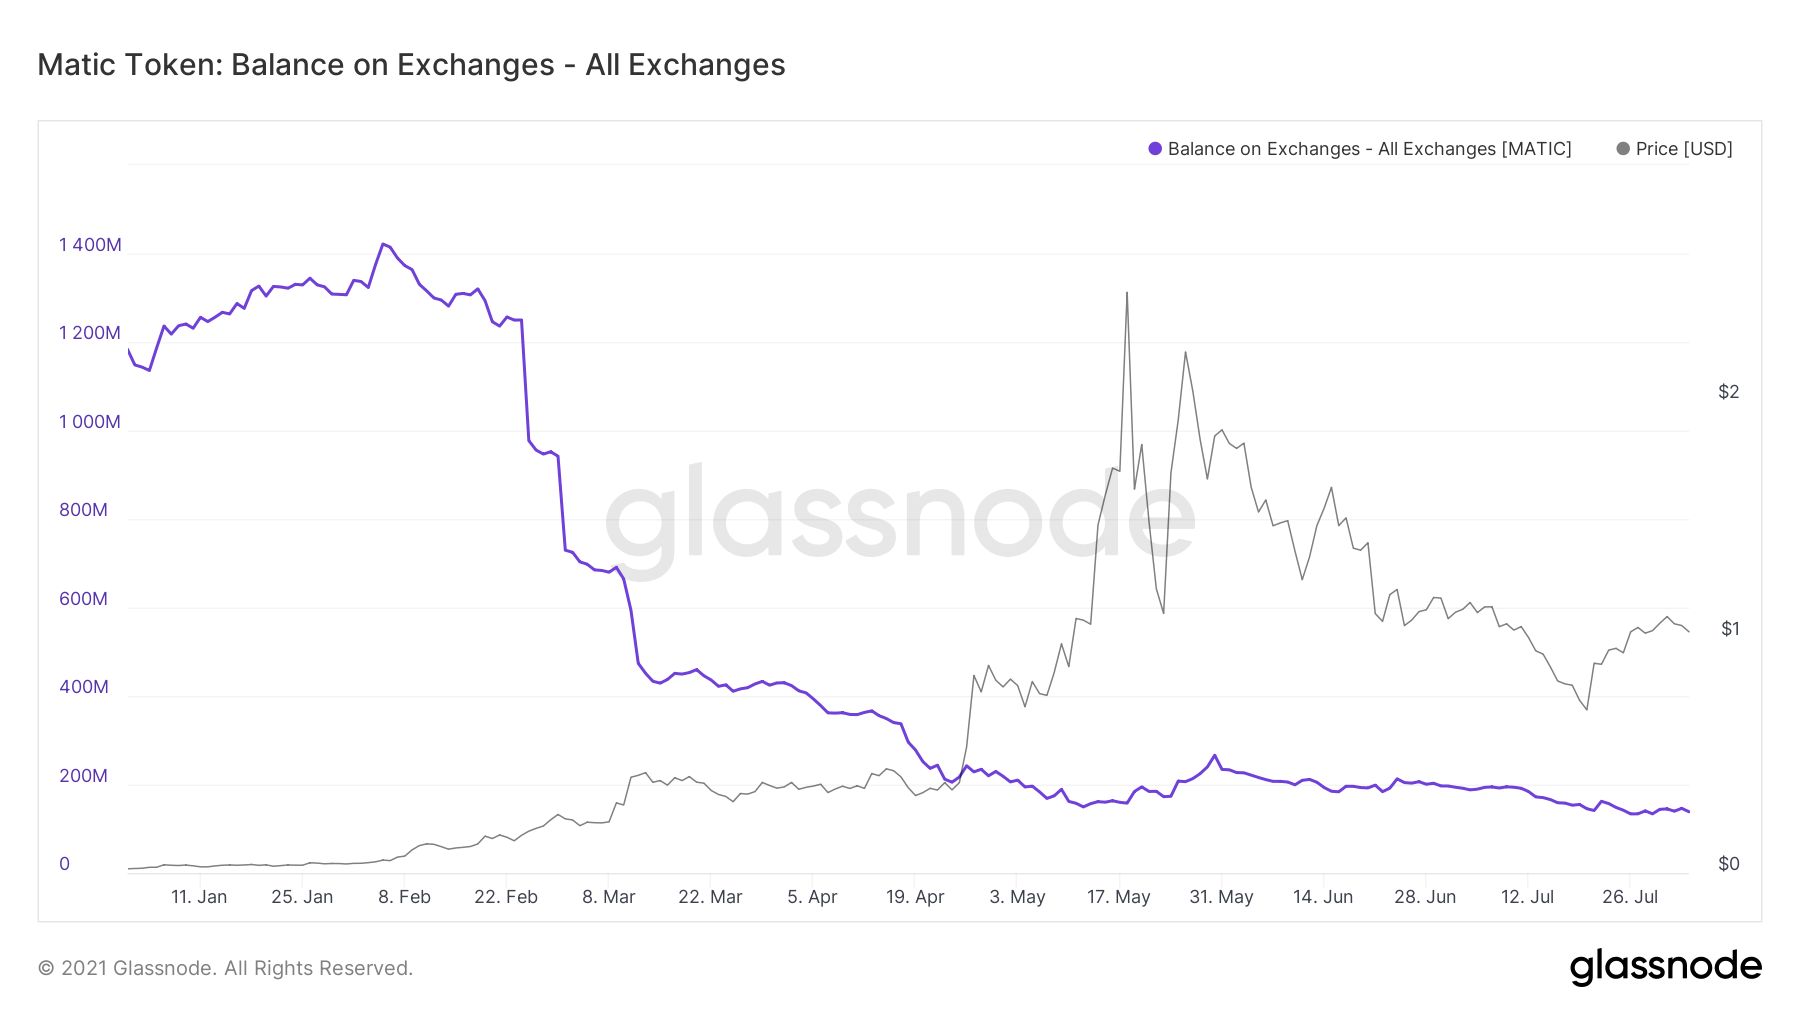
MATIC supply on exchanges chart
Additionally, IntoTheBlock’s Global In/Out of the Money (GIOM) model shows that a significant chunk of “Out of the Money” investors are present between $1.19 and $1.37. Here, roughly 6,350 addresses that purchased 691.43 million MATIC tokens are underwater and hence the only significant resistance barrier that can hinder the upswing.
A sudden spike in buying pressure that produces a decisive close above $1.37 will put these market participants at breakeven, negating the potential selling pressure and opening up the path to retest the all-time high at $2.70.
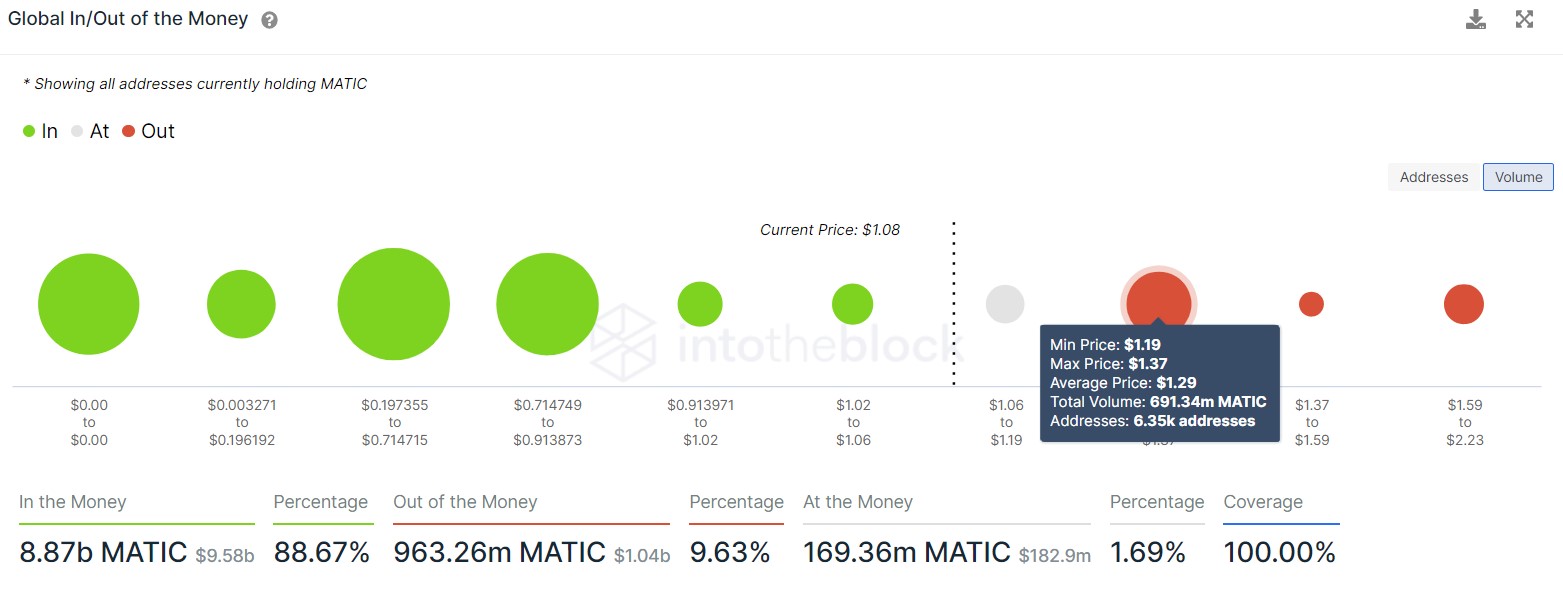
MATIC GIOM chart
All in all, things look positive for Polygon, except for the resistance barrier that extends from $1.19 to $1.37. Assuming the buying pressure falls short and fails to close above $1.37 after shattering the neckline, investors can expect MATIC price to consolidate above $1.20.
However, if the bears push Polygon to slice through $1.20 and produce a decisive 12-hour candlestick close below $1, it will set up a lower low, signaling the shift in the trend toward the sellers.
Such a move will invalidate the bullish thesis and trigger a 7% sell-off to $0.928.
Author

Akash Girimath
FXStreet
Akash Girimath is a Mechanical Engineer interested in the chaos of the financial markets. Trying to make sense of this convoluted yet fascinating space, he switched his engineering job to become a crypto reporter and analyst.