Final call to buy Ethereum before it breaks out to $4,000
- Ethereum price shows signs of a further uptrend after rallying 36% in the last two weeks.
- On-chain metrics suggest the possibility of revisiting $4,000 after a minor retracement.
- A daily candlestick close below the 50-day SMA at $2,848 will invalidate the bullish thesis for ETH.

Ethereum price rally seems extended for a further upswing, but a minor retracement will take the edge off, allowing for another leg-up. On-chain metrics support the possibility of a short-term retracement with a long-term bullish outlook for ETH.
Ethereum price readies for more gains
Ethereum price rallied roughly 36% in less than two weeks, starting March 14. This massive uptrend has shattered through the 50-day and 100-day Simple Moving Averages (SMAs) at $2,848 and $3,045 and is currently trading at $3,376.
If the uptrend continues, ETH will face the 200-day SMA at $3,489 and is likely to face rejection due to the lack of bullish momentum. Hence, a minor retracement to the $3,136, coinciding with the high volume node seems likely.
Interestingly, the 100-day SMA is in proximity to absorb the incoming selling pressure, making this level a high probability reversal zone.
Therefore, a bounce off the $3,36 barrier could trigger a rally that propels Ethereum price to conquer the 200-day SMA and make its way to the low volume node at $3,703. Clearing this hurdle is important, else a local top could form here with ETH moving sideways.
If buyers manage to move past the low volume node, there is a good chance that Ethereum price will target the $4,040 level, which is another high volume node as seen in the volume profile. In total, this run-up would constitute a 30% gain and is likely where the upside is limited for ETH.
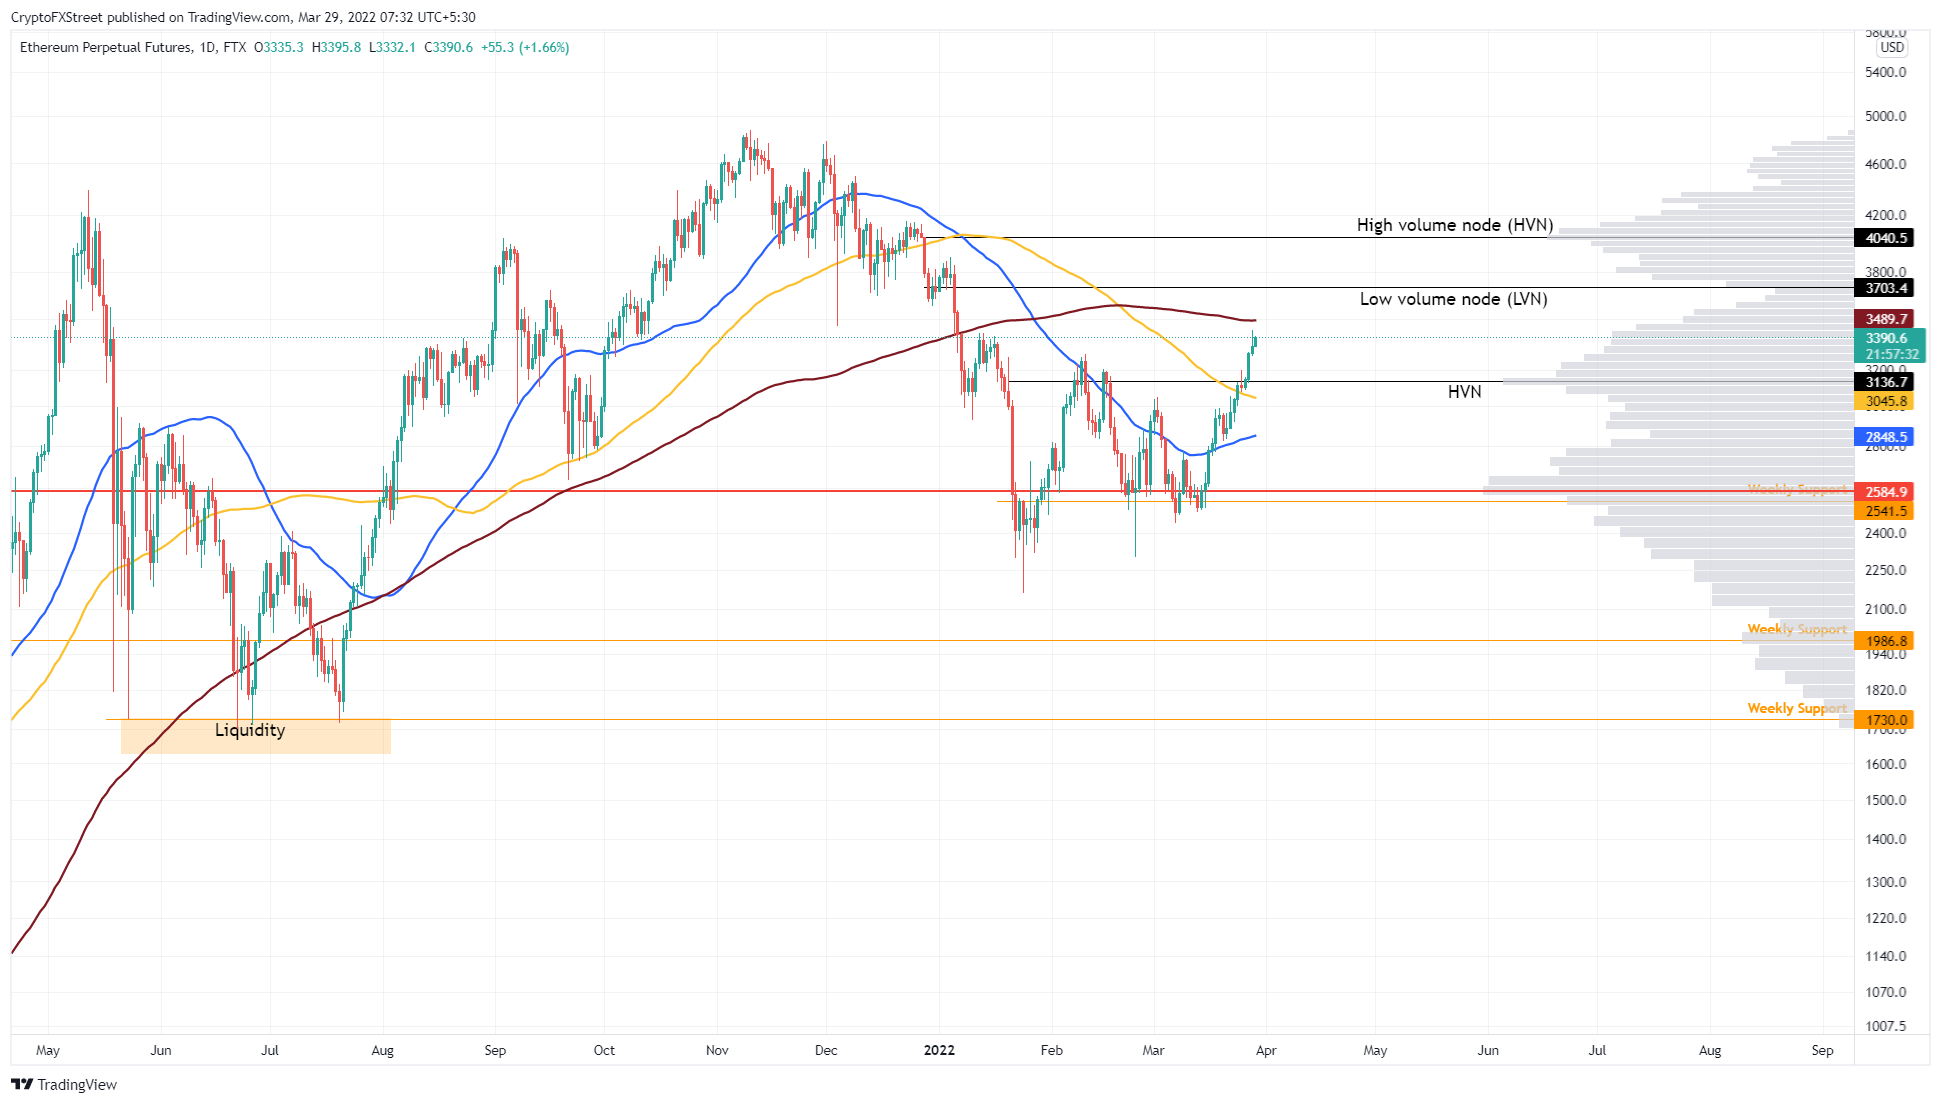
ETH/USDT 1-day chart
Supporting the minor retracement for ETH is the recent uptick witnessed in the intraday Market Value to Realized Value (MVRV). This on-chain metric is used to determine the average profit/loss of investors that purchased ETH over the past month.
An uptick in this metric denotes the cluster of investors in profit and hence reveals the potential of a sell-off. Any spikes in this metric above 15% have often met with a sell-off in Ethereum price. The same can be seen in the recent history of ETH. Hence, a minor retracement semes likely for the smart contract token.
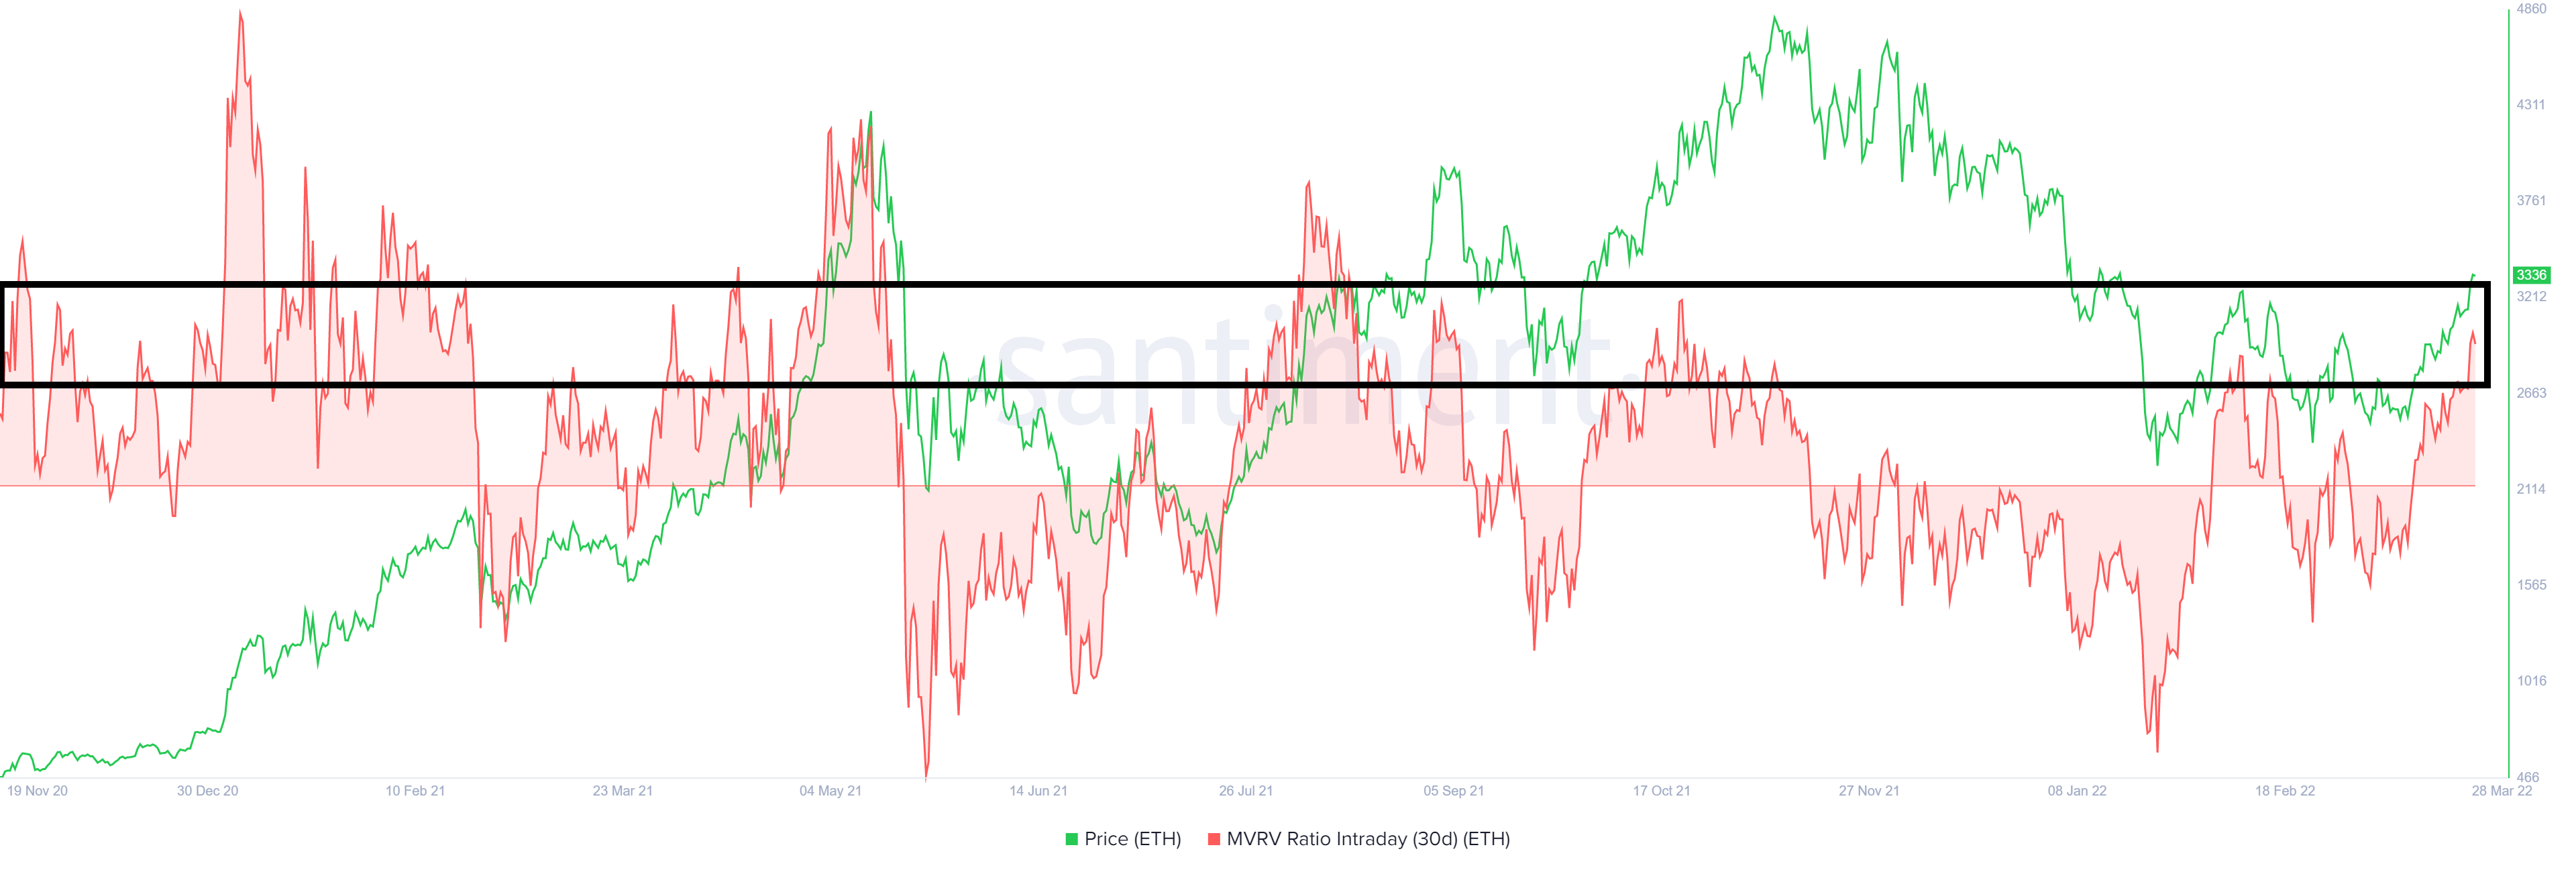
ETH 30-day intraday MVRV
While the short-term outlook reveals a pullback, the on-chain volume for ETH shows that the recent uptrend was backed by an increase in on-chain volume from 14.5 billion to 16.2 billion from November 2021 to March 2022.
This 11.7% spike suggests that the run-up was not a fluke and that Ethereum price is likely to continue going higher.
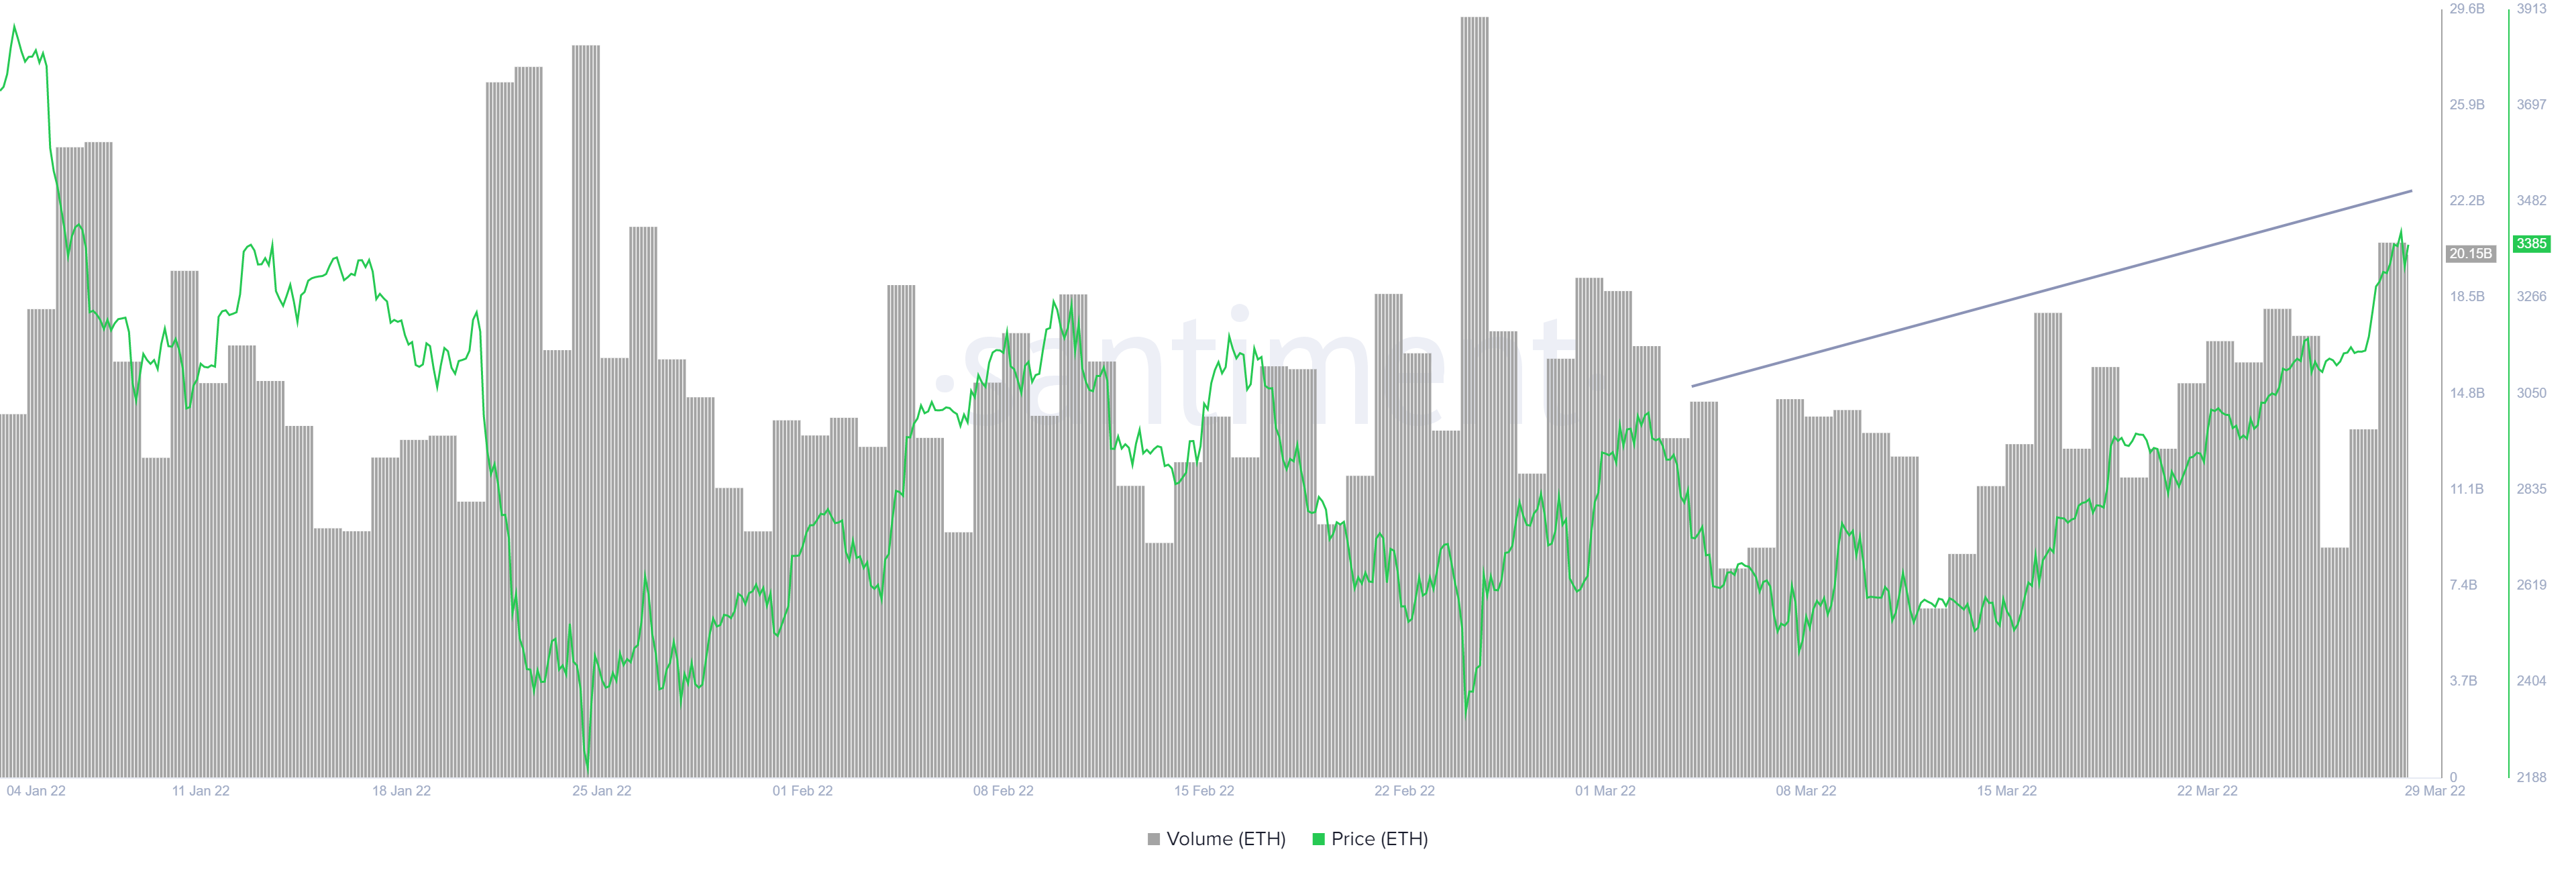
ETH on-chain volume
The supply of ETH on exchanges has deteriorated from 16.31 million to 15.61 million in the last two months or so. The 4.3% decline further reveals that the investors are growing confident in the price performance of Ethereum and are moving their holdings off centralized entities.
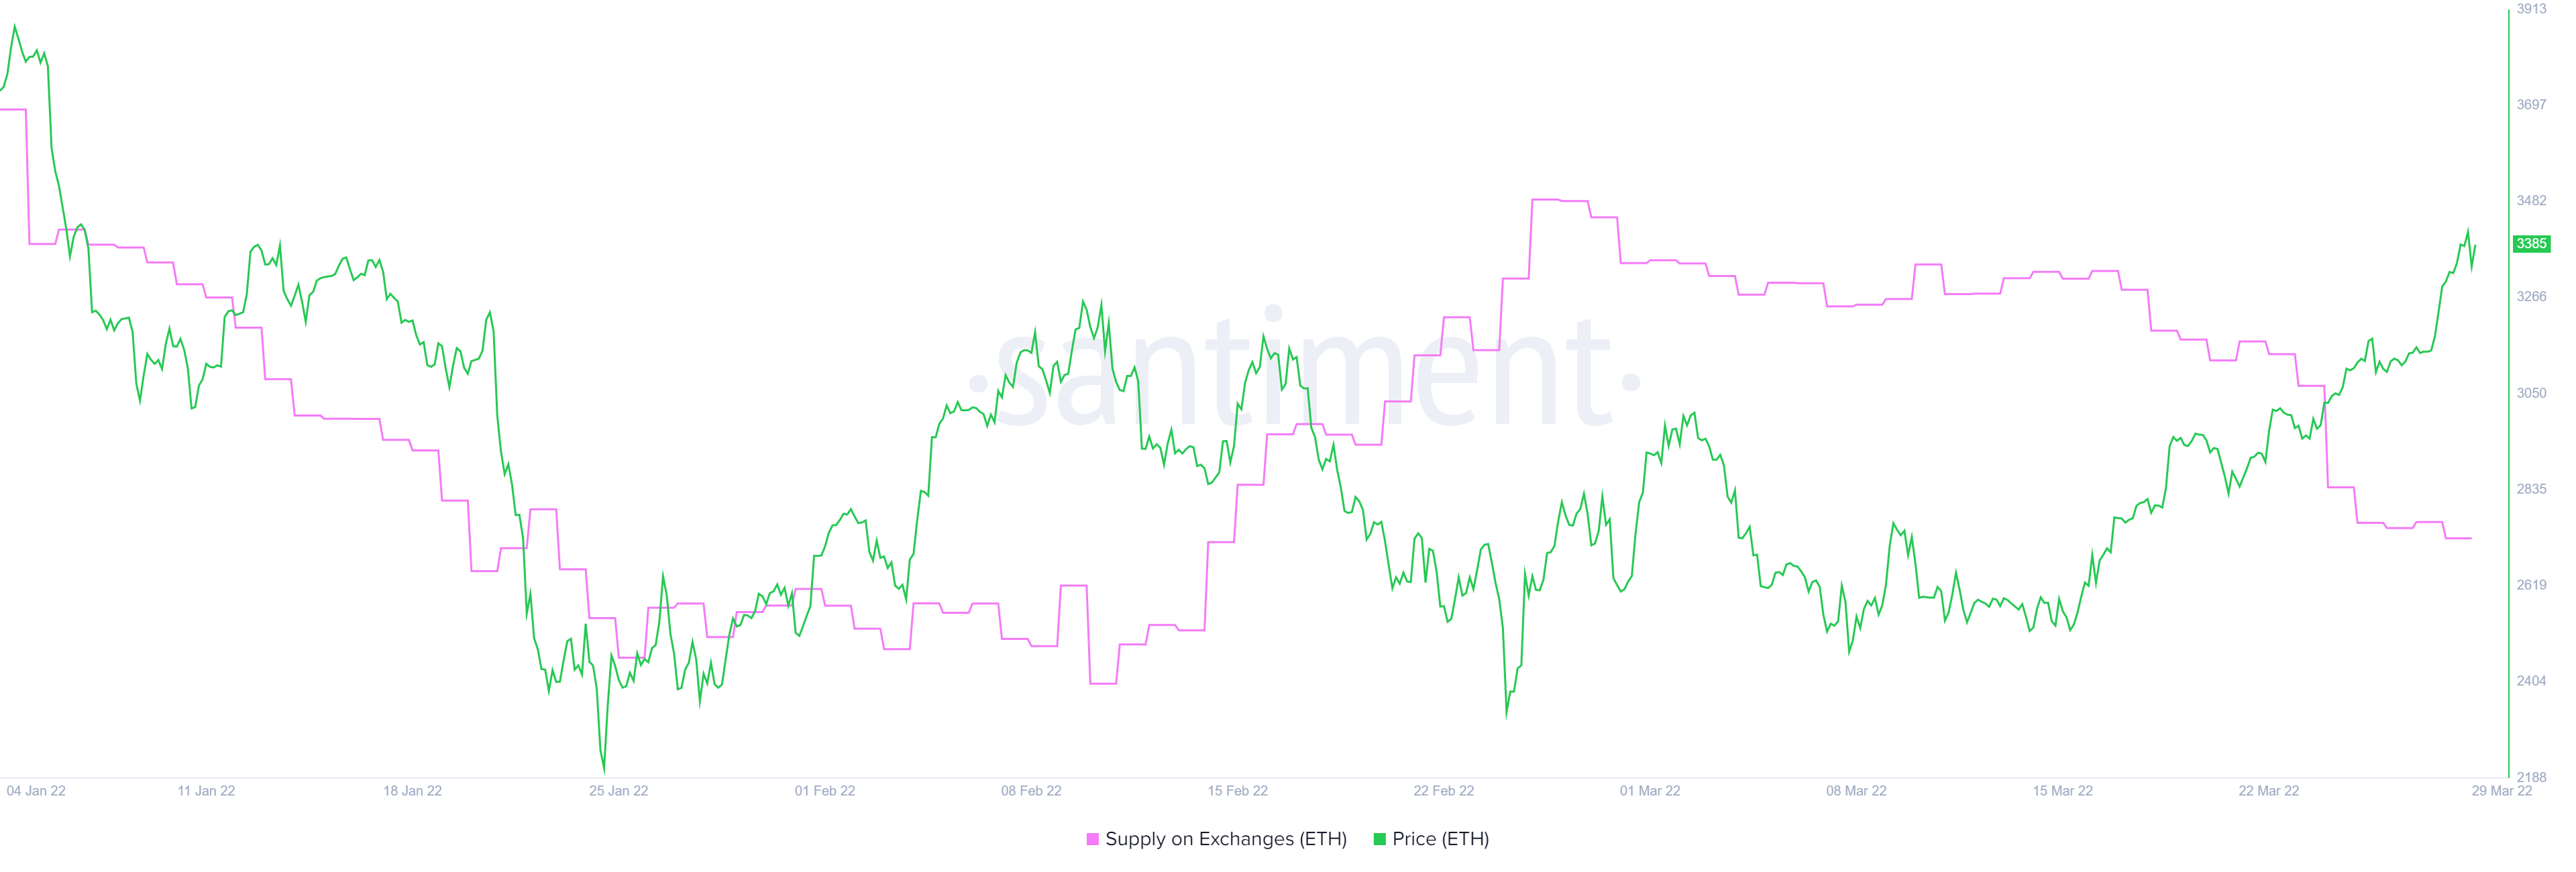
ETH supply on exchanges
The exchange net position change paints the most bullish picture for the Ethereum price. Over the past two weeks, the outflow of ETH from trading platforms has only been increasing. The last time such a drastic decline was witnessed was in October 2021, when ETH rose from $1,730 to $4,800 and higher.
Therefore, the current state of this index suggests that investors are bullish on Ethereum price and denotes that an uptrend is likely.
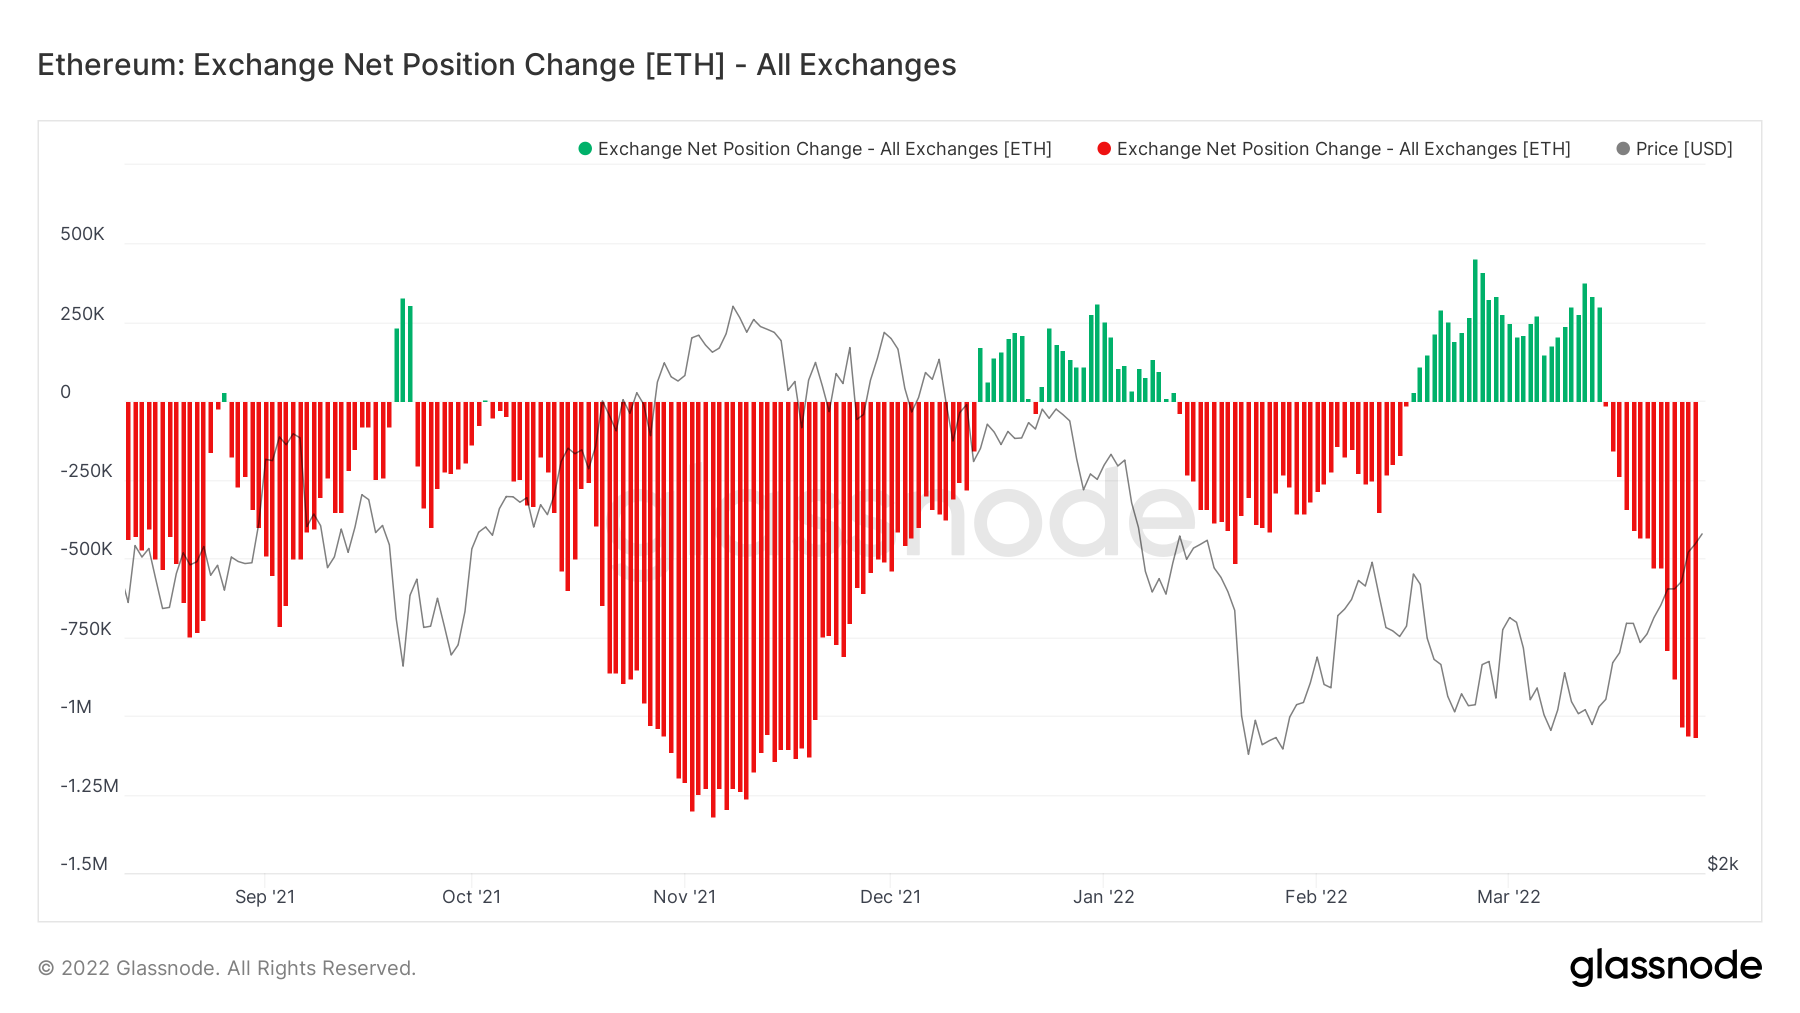
ETH exchange net position change
All in all, the outlook for Ethereum price looks bullish with just a minor retracement. If the directional bias remains bullish as it has for the past two weeks, there is a good probability that ETH will revisit $4,000. However, if the Bitcoin price decides to crash the party, then Ethereum will follow suit.
If Ethereum price slices through the 100-day SMA at $3,046, it will denote a weakness among buyers and likely knock the altcoin down to retest the 50-day SMA at $2,849. Here, buyers have a chance to come back, but a daily candlestick close below $2,848 will invalidate the bullish thesis.
In such a case, Ethereum price will likely crash 10% to revisit the point of control at $2,584.
Author

Akash Girimath
FXStreet
Akash Girimath is a Mechanical Engineer interested in the chaos of the financial markets. Trying to make sense of this convoluted yet fascinating space, he switched his engineering job to become a crypto reporter and analyst.


