Filecoin price forecast as FIL juggles between two order blocks
- Filecoin price is up 12% after an 8% slump to the monthly low of $2.970 recorded on September 11.
- FIL could fall 5% to test the $3.233 support level, with a possible breach to collect the liquidity resting underneath.
- Invalidation of the bearish outlook would occur if the altcoin records a decisive 4-hour candlestick close above $3.500.

Filecoin (FIL) price is trading with a bullish bias, after sustaining the uptrend for the last three days. However, the rally could be interrupted by selling pressure from a crucial zone, unless bullish momentum takes prominence.
Also Read: Top 3 Price Prediction Bitcoin, Ethereum, Ripple: Next move for BTC as it faces crucial resistance
Filecoin price eyes 5% slump
Filecoin (FIL) price is on a recovery rally after a 16% fall from the August 31 crash. Having ascended almost 15%, the altcoin is facing a supply zone at around $3.400. This is an order block where sellers abound. As such, it is populated by aggressive sellers, thereby presenting as a likely area for FIL to be rejected if the order block holds as a resistance level.
A rejection from the supply zone at $3.400 is likely to send Filecoin price down toward the $3.233 support level, or lower to tag the demand zone at around $3.200. A demand zone is an order block where strong buyer momentum is expected. As such, this could be where FIL pulls back again, but it all depends on whether this order block at around $3.200 will hold as a support level. If it does, a quick dip into the demand zone would be likely in what is considered a liquidity sweep before a run-up north.
However, if the demand zone fails, Filecoin price could extrapolate the losses failing the demand zone and rendering it a bearish breaker.
The Relative Strength Index (RSI) at 71 is headed north, suggesting rising momentum. However, its position above 70 borders along being overbought, which means Filecoin price is at risk of a drawdown. However, this is pending confirmation, which would happen once the RSI crosses below the 70 level to the downside, thereby confirming Welles Wilder’s interpretation of an overbought asset.
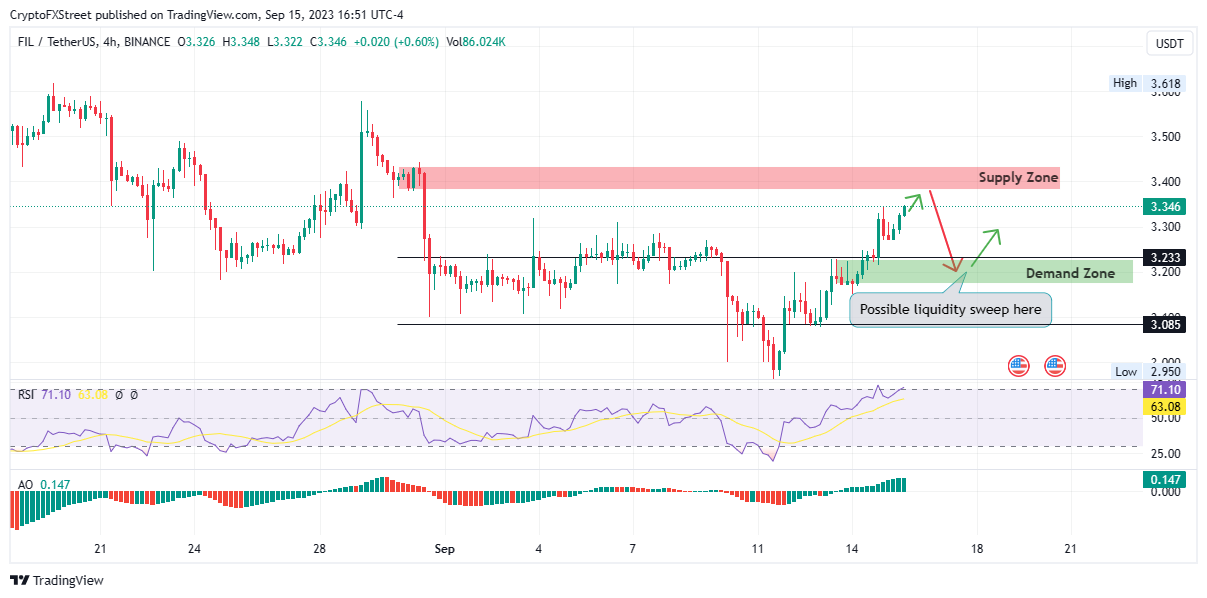
FIL/USDT 4-hour chart
Based on the trajectory of the RSI and the overall outlook of the Awesome Oscillator (AO) whose histograms are soaked in green, the upside potential for Filecoin price remains plausible. In this case, FIL could shatter the supply zone, failing it as a resistance level and converting it to a bullish breaker. A move north would likely lead the altcoin to the $3.500 resistance level, last tested in late August.
Cryptocurrency metrics FAQs
What is circulating supply?
The developer or creator of each cryptocurrency decides on the total number of tokens that can be minted or issued. Only a certain number of these assets can be minted by mining, staking or other mechanisms. This is defined by the algorithm of the underlying blockchain technology. Since its inception, a total of 19,445,656 BTCs have been mined, which is the circulating supply of Bitcoin. On the other hand, circulating supply can also be decreased via actions such as burning tokens, or mistakenly sending assets to addresses of other incompatible blockchains.
What is market capitalization?
Market capitalization is the result of multiplying the circulating supply of a certain asset by the asset’s current market value. For Bitcoin, the market capitalization at the beginning of August 2023 is above $570 billion, which is the result of the more than 19 million BTC in circulation multiplied by the Bitcoin price around $29,600.
What is trading volume?
Trading volume refers to the total number of tokens for a specific asset that has been transacted or exchanged between buyers and sellers within set trading hours, for example, 24 hours. It is used to gauge market sentiment, this metric combines all volumes on centralized exchanges and decentralized exchanges. Increasing trading volume often denotes the demand for a certain asset as more people are buying and selling the cryptocurrency.
What is funding rate?
Funding rates are a concept designed to encourage traders to take positions and ensure perpetual contract prices match spot markets. It defines a mechanism by exchanges to ensure that future prices and index prices periodic payments regularly converge. When the funding rate is positive, the price of the perpetual contract is higher than the mark price. This means traders who are bullish and have opened long positions pay traders who are in short positions. On the other hand, a negative funding rate means perpetual prices are below the mark price, and hence traders with short positions pay traders who have opened long positions.
Author

Lockridge Okoth
FXStreet
Lockridge is a believer in the transformative power of crypto and the blockchain industry.


