- Fetch.ai is up almost 10% in 24 hours, and about 60% over the last week.
- Joining the BTC rally, FET is the leading AI crypto gainer, with GRT, INJ, ROSE, and AGIX trailing.
- The surge has seen the altcoin test $0.3144, a level last tested in May with prospects for additional gains.
- Invalidation of the bullish outlook will occur if the crypto breaks and closes below the $0.2000 psychological level.
Fetch.ai (FET) price kicked off a rally late last week that has culminated to an uptrend, positioning the AI crypto coin among the top gainers on October 26. It leads this class of altcoins in following the lead of Bitcoin (BTC), which continues to surge with the $35,000 psychological level now on the horizon.
Fetch.ai leads AI coins behind Bitcoin
Fetch.ai (FET) price is up almost 10% in the last 24 hours and 60% over the last seven days, joining the broader market in what may very well pan out to be a bull run if Bitcoin confirms above $35,000 psychological level, or for the conservatives, a breach and close above $40,000.
For clarity, AI cryptocurrencies are tokens powering AI blockchain platforms, including but not limited to The Graph (GRT), SingularityNET (AGIX), Oasis Network (ROSE), Injective (INJ), and Fetch.ai (FET), among others. Out of these, FET is the biggest gainer, based on CoinMarketCap data. Users spend these tokens when they want to use their ecosystems and leverage the benefits of their integrated artificial intelligence.
GRT, AGIX, INJ, and ROSE are up 9%, 7%, 3%, and 8%, respectively, while FET boasts a stark 10% gain and heading up on the daily timeframe, leading its AI counterparts.
Fetch.ai price outlook as FET reclaims May highs
Fetch.ai price has tagged $0.3144 after the breakout, a level last seen in May. However, the price was rejected quickly, but remains above the supply zone, now turned bullish breaker and extending from $0.2514 to $0.2683. For as long as this order block holds as a support level, the upside potential remains in the cards for FET.
Based on the Relative Strength Index (RSI) outlook, momentum continues to rise, as it is inclined north. The Awesome Oscillator (AO) also tells a similar story, recording a series of green histogram bars in the positive territory. This shows bulls are leading the market.
Increased buying pressure above current levels could see Fetch.ai price confirm above the $0.3144 resistance level, flipping it into a support floor. Such a move would clear the path for a foray to the $0.3500 psychological level, denoting a 15% climb above current levels. In a highly bullish case, it could extrapolate the gains to the $0.4000 range high.
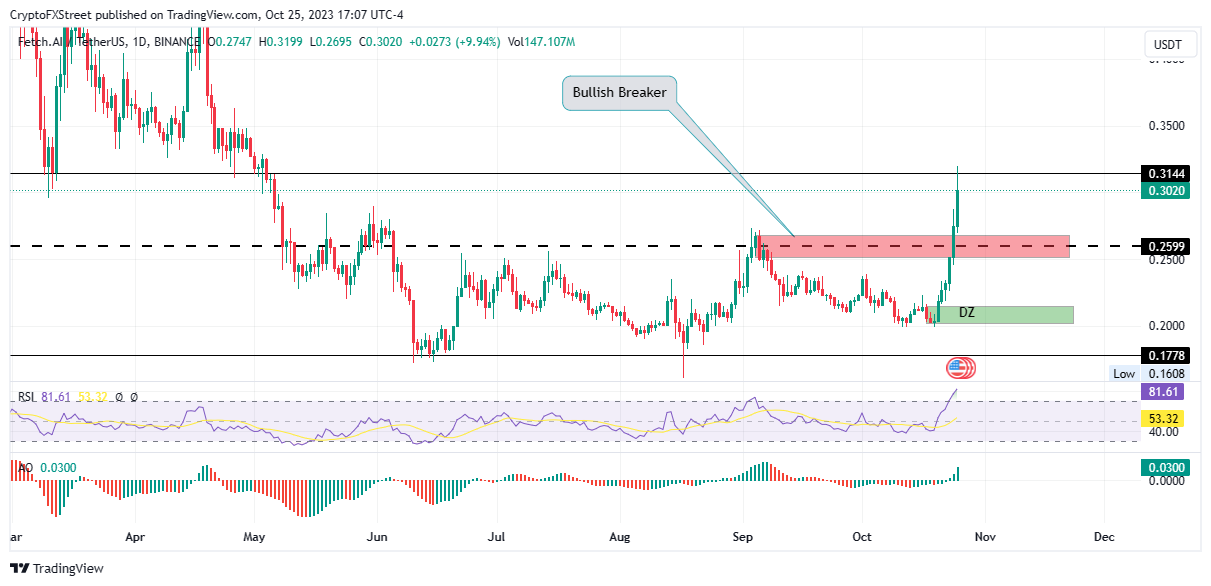
FET/USDT 1-day chart
IntoTheBlock’s “ Global In/Out of the Money” (GIOM) model reveals there is no immediate supply barrier that could limit Fetch.ai price from achieving its upside potential. Based on this on-chain metric, there is only one major area of interest between extending from $0.3334 to $1.0200 that is filled by a some investors who had previously bought FET around the $0.5834 price level. Here, approximately 492 addresses are holding nearly 11.54 million FET tokens.
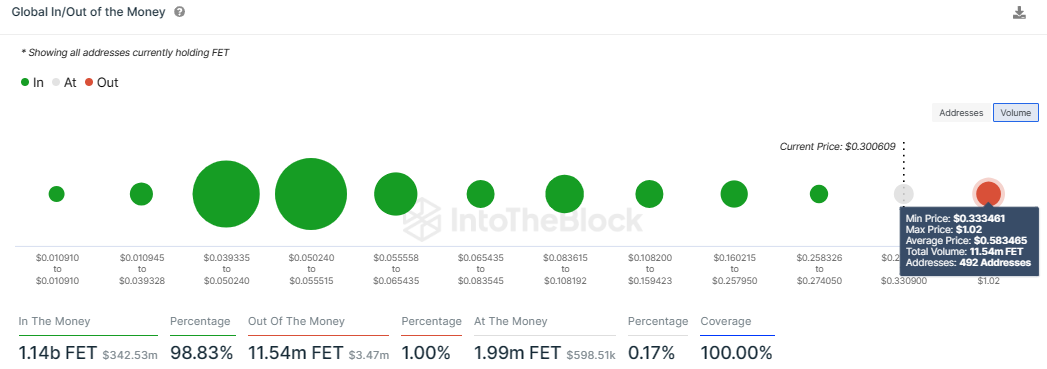
FET GIOM
On the other hand, a rejection from the $0.3144 could see Fetch.ai price pull back, possibly failing the supply zone order block as a support. A break and close below this level, would confirm the downtrend. For longs, their stop losses should probably be right below the $0.2599 midline, because a decisive daily candlestick close below this level would open the drains and clear the clog for FET to dwindle in value.
In the dire case, the slump could send Fetch.ai price to the demand zone, ranging from $0.2150 to $0.2019. A solid move below the $0.2000 psychological level would commence a fresh downtrend, as this marks the last lower low. This would invalidate the bullish thesis.
Information on these pages contains forward-looking statements that involve risks and uncertainties. Markets and instruments profiled on this page are for informational purposes only and should not in any way come across as a recommendation to buy or sell in these assets. You should do your own thorough research before making any investment decisions. FXStreet does not in any way guarantee that this information is free from mistakes, errors, or material misstatements. It also does not guarantee that this information is of a timely nature. Investing in Open Markets involves a great deal of risk, including the loss of all or a portion of your investment, as well as emotional distress. All risks, losses and costs associated with investing, including total loss of principal, are your responsibility. The views and opinions expressed in this article are those of the authors and do not necessarily reflect the official policy or position of FXStreet nor its advertisers. The author will not be held responsible for information that is found at the end of links posted on this page.
If not otherwise explicitly mentioned in the body of the article, at the time of writing, the author has no position in any stock mentioned in this article and no business relationship with any company mentioned. The author has not received compensation for writing this article, other than from FXStreet.
FXStreet and the author do not provide personalized recommendations. The author makes no representations as to the accuracy, completeness, or suitability of this information. FXStreet and the author will not be liable for any errors, omissions or any losses, injuries or damages arising from this information and its display or use. Errors and omissions excepted.
The author and FXStreet are not registered investment advisors and nothing in this article is intended to be investment advice.
Recommended Content
Editors’ Picks

Crypto fraud soars as high-risk addresses on Ethereum, TRON networks receive $278 billion
The cryptocurrency industry is growing across multiple facets, including tokenized real-world assets, futures and spot ETFs, stablecoins, Artificial Intelligence (AI), and its convergence with blockchain technology, as well as the dynamic decentralized finance (DeFi) sector.

Bitcoin eyes $100,000 amid Arizona Reserve plans, corporate demand, ETF inflows
Bitcoin price is stabilizing around $95,000 at the time of writing on Tuesday, and a breakout suggests a rally toward $100,000. The institutional and corporate demand supports a bullish thesis, as US spot ETFs recorded an inflow of $591.29 million on Monday, continuing the trend since April 17.

Meme coins to watch as Bitcoin price steadies
Bitcoin price hovers around $95,000, supported by continued spot BTC ETFs’ inflows. Trump Official is a key meme coin to watch ahead of a stakeholder dinner to be attended by President Donald Trump. Dogwifhat price is up 47% in April and looks set to post its first positive monthly returns this year.

Cardano Lace Wallet integrates Bitcoin, boosting cross-chain capabilities
Cardano co-founder Charles Hoskinson announced Monday that Bitcoin is integrated into the Lace Wallet, expanding Cardano’s ecosystem and cross-chain capabilities. This integration enables users to manage BTC alongside Cardano assets, providing support for multichain functionality.
Bitcoin Weekly Forecast: BTC consolidates after posting over 10% weekly surge
Bitcoin (BTC) price is consolidating around $94,000 at the time of writing on Friday, holding onto the recent 10% increase seen earlier this week.

The Best brokers to trade EUR/USD
SPONSORED Discover the top brokers for trading EUR/USD in 2025. Our list features brokers with competitive spreads, fast execution, and powerful platforms. Whether you're a beginner or an expert, find the right partner to navigate the dynamic Forex market.