|

Fetch AI consolidates within a bullish triangle pattern [Video]

Fetch.AI with ticker FETUSD is trading sideways after a completed wave (3) back in March 2024, so it’s most likely moving within a bullish ABCDE triangle pattern in wave (4) that can take a little bit more time before a bullish breakout into a wave (5) in 2025.
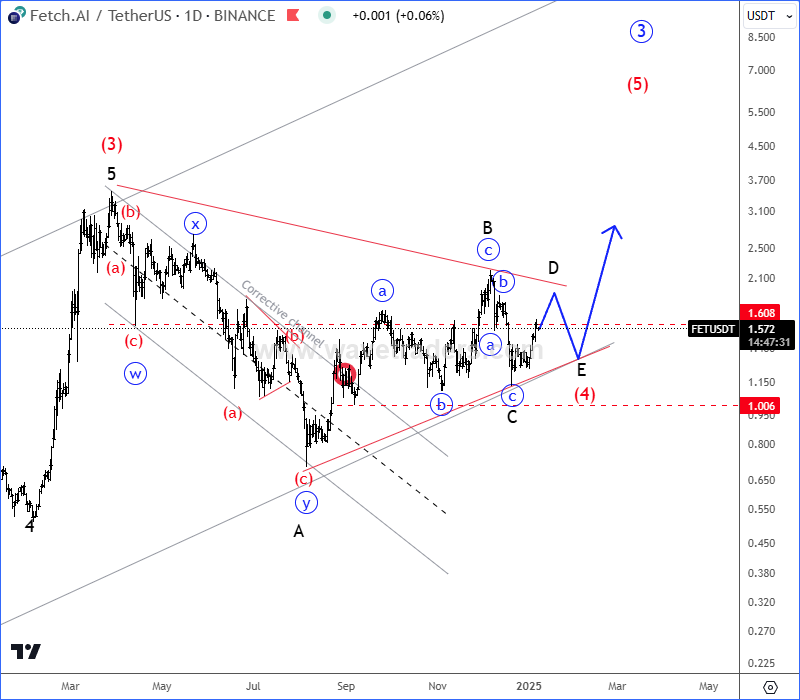
Chart

FETUSD Daily Chart

A triangle appears to reflect a balance of forces, causing a sideways movement that is usually associated with decreasing volume and volatility. The triangle pattern contains five overlapping waves that subdivide 3-3-3-3-3 and are labeled A-B-C-D-E. It’s a region of horizontal price movement, a consolidation of a prior move, and it is composed of “threes.” That means each of the A-B-C-D-E waves have three subwaves. The triangle pattern is generally categorized as a continuation pattern, meaning that after the pattern completes, it’s assumed that the price will continue in the trend direction it was moving before the pattern appeared. However, triangles also indicate that the final leg is coming before a reversal and that’s why triangles are labeled in wave B, wave X or wave 4.

fxsoriginal

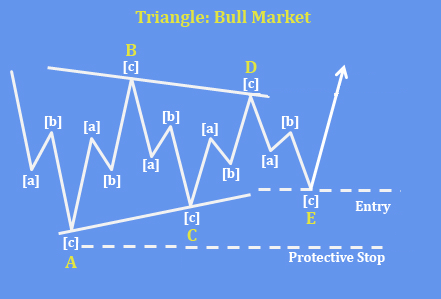
Basic Bullish Triangle Pattern – Trading Setup #1

fxsoriginal

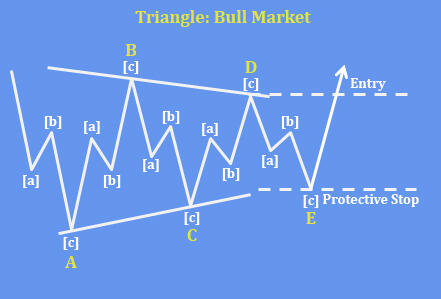
Basic Bullish Triangle Pattern – Trading Setup #2

For more analysis like this you may want to watch below our latest recording of a live webinar streamed on January 06 2025:


Get Full Access To Our Premium Elliott Wave Analysis For 14 Days. Click here.


Get Full Access To Our Premium Elliott Wave Analysis For 14 Days. Click here.

Author

Gregor Horvat

Gregor Horvat

Wavetraders

Experience Grega is based in Slovenia and has been in the Forex market since 2003.

More from Gregor Horvat
Share:

Markets move fast. We move first.

Orange Juice Newsletter brings you expert driven insights - not headlines. Every day on your inbox.

By subscribing you agree to our Terms and conditions.

Editor's Picks

Crypto Today: Bitcoin, Ethereum, XRP slide further as risk-off sentiment deepens

Bitcoin faces extended pressure as institutional investors reduce their risk exposure. Ethereum’s upside capped at $3,000, weighed down by ETF outflows and bearish signals. XRP slides toward November’s support at $1.82 despite mild ETF inflows.

Ripple eyes record high breakout in 2026 as Ripple scales infrastructure

XRP has traded under pressure, but short-term support keeps hopes of a sustainable recovery in 2026 alive. The launch of XRP ETFs and regulatory clarity in the US pave the way for institutional adoption.

Bitcoin risks deeper correction as ETF outflows mount, derivative traders stay on the sidelines

Bitcoin (BTC) remains under pressure, trading below $87,000 on Wednesday, nearing a key support level. A decisive daily close below this zone could open the door to a deeper correction.

Monero builds momentum amid bullish bets and looming resistance

Monero (XMR) trades close to $430 at press time on Wednesday, after a 5% jump on the previous day. The privacy coin regains retail interest, evidenced by heightened Open Interest and long positions.

Orange Juice Newsletter – Smart insights by real people. Every day.

A free newsletter highlighting key market trends to help traders stay a step ahead. Daily insights on the most relevant trading topics, compiled by our experts in an easy-to-read format so you never miss an important move.

Bitcoin: Fed delivers, yet fails to impress BTC traders

Bitcoin (BTC) continues de trade within the recent consolidation phase, hovering around $92,000 at the time of writing on Friday, as investors digest the Federal Reserve’s (Fed) cautious December rate cut and its implications for risk assets.