|

ETH/USD Elliott Wave analysis – Looks for correction

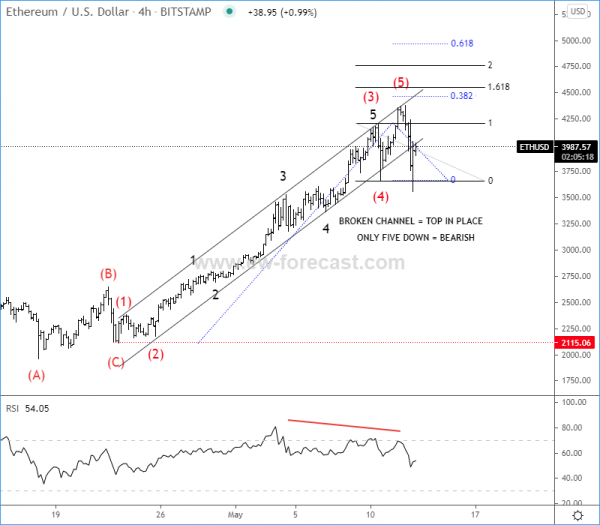
  • ETHUSD completes five wave cycle.

  • It has broken Elliott Wave Channel Support Line.

  • RSI shows bearish divergence. 

Ethereum, the world’s second-largest cryptocurrency, breaks well above $4,000 but investors may not get too excited around here as ETHUSD can be trading in a fifth wave, final leg of a five-wave rise from 2115 level. We know that five waves may suggest a slow of a current cycle, maybe already this month at 4500-5000 area where we see some projections for a fifth wave. 

At the same time it's worth to mention that we see subwave 5) near upper Elliott Wave channel resistance line while RSI also shows a divergence, so it can be very late for any new longs. Of course the trend is up, no doubt, but it’s good to be patient and be aware of a dips and maybe rather look for a new opportunities after three wave retracements. 

Interesting first support can be here at 3500, at the former wave four, but ETHUSD has broken Elliott Wave channel support line, so in case if we see a five-wave decline, then ETH may face a deeper corrective decline.

ETH/USD 4h Elliott Wave analysis chart

ETHUSD

Finally, another ELLIOTT WAVE OPEN DOOR Event is here. See all of our charts FREE for 10 days. Join us at www.ew-forecast.com/register

Author

Gregor Horvat

Gregor Horvat

Wavetraders

Experience Grega is based in Slovenia and has been in the Forex market since 2003.

More from Gregor Horvat
Share:

Editor's Picks

Ripple exposed to volatility amid low retail interest, modest fund inflows

Ripple (XRP) is extending its intraday decline to around $1.40 at the time of writing on Monday amid growing pressure from the retail market and risk-off sentiment that continues to keep investors on the sidelines.

Crypto Today: Bitcoin steadies around $70,000, Ethereum and XRP remain under pressure 

Bitcoin hovers around $70,000, up near 15% from last week's low of $60,000 despite low retail demand. Ethereum delicately holds $2,000 support as weak technicals weigh amid declining futures Open Interest.

Pi Network extends decline as steady mainnet migration adds pressure

PI edges lower by over 3% at press time on Monday, marking a third consecutive day of losses. The declining trend in PI aligns with the steady mainnet migration of PI tokens, which may fuel selling pressure. The technical outlook for PI remains bearish, with bearish momentum persisting. 

Bitcoin slips below $70,000 as ETF outflows, realized losses fuel bearish outlook

Bitcoin price trades in red below $70,000 on Monday after correcting nearly 9% in the previous week. US-listed spot ETFs recorded a $318 million weekly outflow, marking the third consecutive week of withdrawals.

Bitcoin Price Annual Forecast: BTC holds long-term bullish structure heading into 2026

Bitcoin (BTC) is wrapping up 2025 as one of its most eventful years, defined by unprecedented institutional participation, major regulatory developments, and extreme price volatility.

Bitcoin: The worst may be behind us

Bitcoin (BTC) price recovers slightly, trading at $65,000 at the time of writing on Friday, after reaching a low of $60,000 during the early Asian trading session. The Crypto King remained under pressure so far this week, posting three consecutive weeks of losses exceeding 30%.