Ethereum Weekly Forecast: Happy birthday Ethereum, to the moon you go
- Ethereum celebrates the fifth birthday in style as it clocks a new 2020 high at $340.
- Ethereum 2.0 final testnet set for release on August 4 as announced by launch coordinator Danny Ryan.
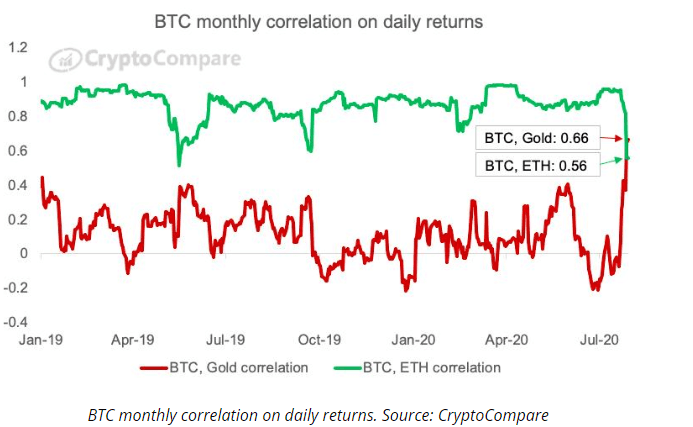
- Ethereum correlation with Bitcoin price stands at 0.56 in July.

Time indeed waits for no one, the old adage goes. As for Ethereum, it has been a great five-year journey. The road has been laced with big wins and a fair share of losses. The blockchain revolution would definitely never be what it is now if not for Ethereum.
Right from the Genesis block on July 30, 2015, Ethereum has continued to be a pacesetter when it comes to a number of leading sections of the cryptocurrency industry including the famous Initial Coin Offering (ICO) era, the ERC-20 tokens that the recent DeFi ecosystem.
The growth of the network has been so significant that it has warranted the redesign and transformation from a Proof-of-Work (PoW) consensus algorithm to a Proof-of-Stake (PoS) protocol through the expected transition to Ethereum 2.0 mainnet. In the coming week, Ethereum developers will launch the last testnet for Ethereum 2.0 that will hopefully start the final phase in preparation for the grand release before the year ends.
At the time of writing, Ethereum is trading $337 after bouncing off a newly established support at $330. Recently, Ether broke many key barriers to trade a new 2020 high at $340. The goal at the momentum is to rise above 2019’s high around $361 and even top $400. For now, finding support above $340 is top on the bulls’ priority list.
July was a great month for the majority of cryptocurrencies but mainly for Ethereum and Bitcoin. As aforementioned, Ethereum hit a new yearly high at $340 from July 1 price of $230. Bitcoin, on the other hand, sprung past $10,000 and even ascended to a new yearly high around $11,400. The breakout was mainly technical for both Ethereum and Bitcoin as it happened following an extended period of very little volatility.
Ethereum 2.0 final testnet
The Ethereum community is waiting with bated breaths for the launch of Ethereum 2.0. The recent announcement that the development will enter its final testnet on August 4 has greatly renewed the hope for a final mainnet launch before the end of the year. According to Danny Ryan, the ETH 2.0 launch coordinator, “the next multi-client testnet (mainnet config including min validator numbers) will have a min genesis time of August 4.” The phase zero of the upgrade has executed on several testnets since the first rollout (Beacon Chain) in April.
Ethereum growing correlation with Bitcoin
Ethereum correlation with Bitcoin price has increased greatly in the last couple of months. Data by data analysis platform CryptoCompare shows the relationship standing at 0.56. The rise in correlation was highlighted by dormant Ethereum markets in spite of DeFi and some smaller altcoins rallying in the first two weeks of July. Like Bitcoin, Ethereum price volatility sunk to a record low, leaving the market motionless. In other words, Ethereum is likely to follow Bitcoin price actions in the coming weeks.
Ethereum technical analysis
Ethereum is trading at $337 amid a push from the bulls to climb above the critical resistance at $340. The last time Ethereum traded in the range between $340 and $360 was last year towards the end of June. Therefore, entering this zone, Ethereum is awaited by increasing selling pressure that must be overcome for gains towards $400 to materialize.
Interestingly, the spike above an ascending channel could still be impacting the price positively; and that explains the bullish reversal from the support at $305. In addition, sentiments have been positive across the community as the network celebrated its fifth anniversary on July 30.
Consequently, technical levels have remained positive since the rally from $230. The Elliot Wave Oscillator has printed a bullish (green) session since the rally started. Unless something drastic happens, Ethereum has the ability to stay above $300 if not $330 in the near term.
The same uptrend is reinforced by the RSI as it holds firmly in the overbought region. However, because of the sharp price action in the last few days, a reversal is not entirely out of the picture. Therefore, keeping watch of the RSI would be in the traders’ best interest.
ETH/USD daily chart
%20(74)-637317839611525611.png&w=1536&q=95)
Author

John Isige
FXStreet
John Isige is a seasoned cryptocurrency journalist and markets analyst committed to delivering high-quality, actionable insights tailored to traders, investors, and crypto enthusiasts. He enjoys deep dives into emerging Web3 tren


