Ethereum Weekly Forecast: ETH plans to restart new bull rally
- Ethereum price retests the $2,927 to $3,151 support zone after the initial attempt failed to catch traction.
- ETH upside seems to be capped at $3,675 from both technical and on-chain perspectives.
- A breakdown of the $2,927 barrier will invalidate the short-term bullish outlook for the smart contract token.

Ethereum price witnessed a minor uptrend as it bounced off a crucial support level. This bull rally failed to catch traction, leading to a steep correction back to the aforementioned foothold. Here, ETH contemplates its next course of action with its odds slightly skewed in favor of bulls.
Ethereum price lacks momentum
Ethereum price rose 16% from January 10 to January 12, setting up a swing high at $3,413. The uptrend left behind a daily support zone, extending from $2,927 to $3,151. Interestingly, this area also harbors the weekly support level at $3,061.
Due to lack of momentum, ETH retraced lower, retesting the support zone. If this uptrend sees participation from sidelined buyers, there is a good chance it will propel the altcoin by 16% to retest the lower limit of the two-day supply zone, stretching from $3,675 3,862.
Ethereum price will need to overcome the 200-day Simple Moving Average (SMA) at $3,480, however, to reach the said supply zone.
In some cases, if the buying pressure sees a massive uptick, ETH could slice through this hurdle and retest the $4,000 psychological barrier or the weekly resistance barrier in close vicinity. This run-up would constitute a 28% ascent.
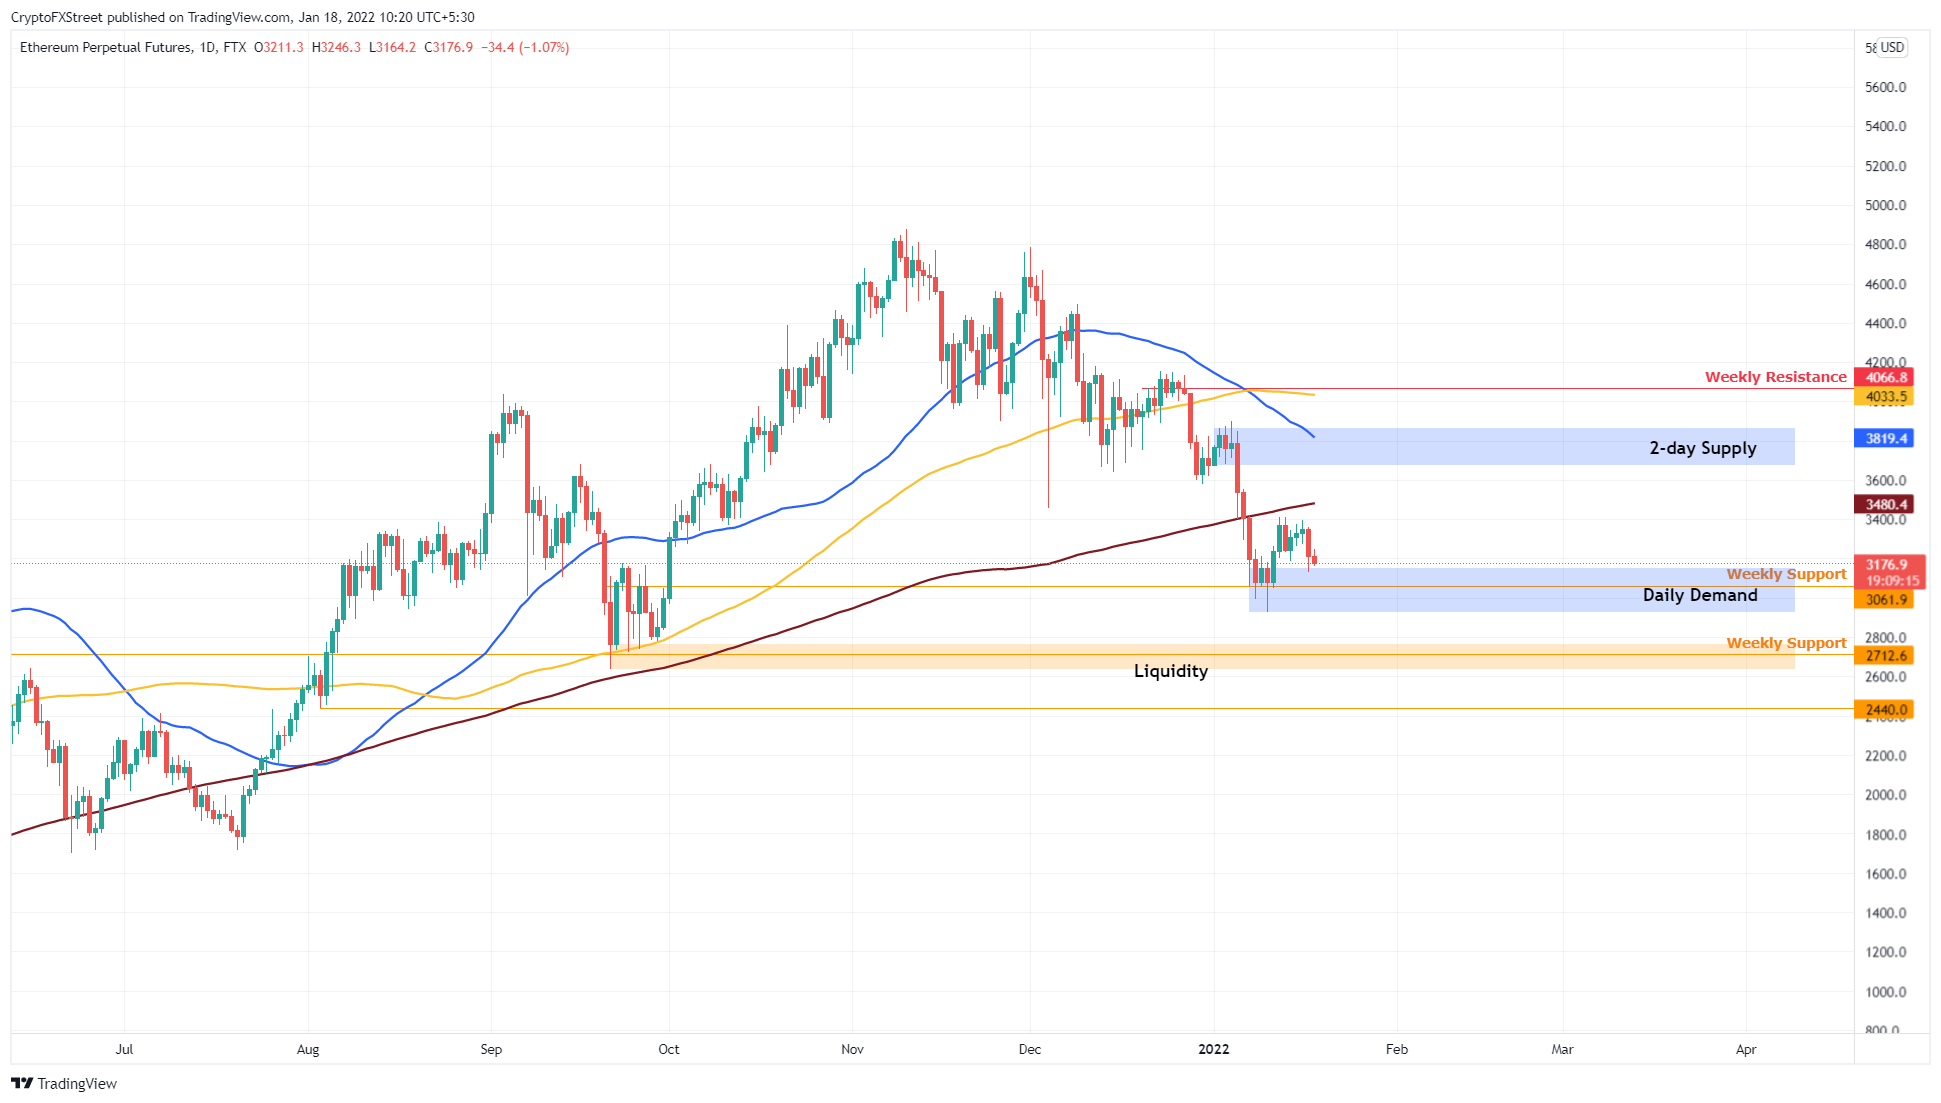
ETH/USDT 1-day chart
While a retest of the $4,000 Ethereum price is optimistic, it is unlikely judging from the IntoTheBlock’s Global In/Out of the Money (GIOM) model. From $3,343 to $3,869, roughly 5.42 million addresses that purchased roughly 21.41 million ETH are “Out of the Money.”
An uptrend is likely to experience selling pressure from this cluster of underwater holders trying to break even. So, a move beyond this cluster would require massive buying momentum, which is unlikely.
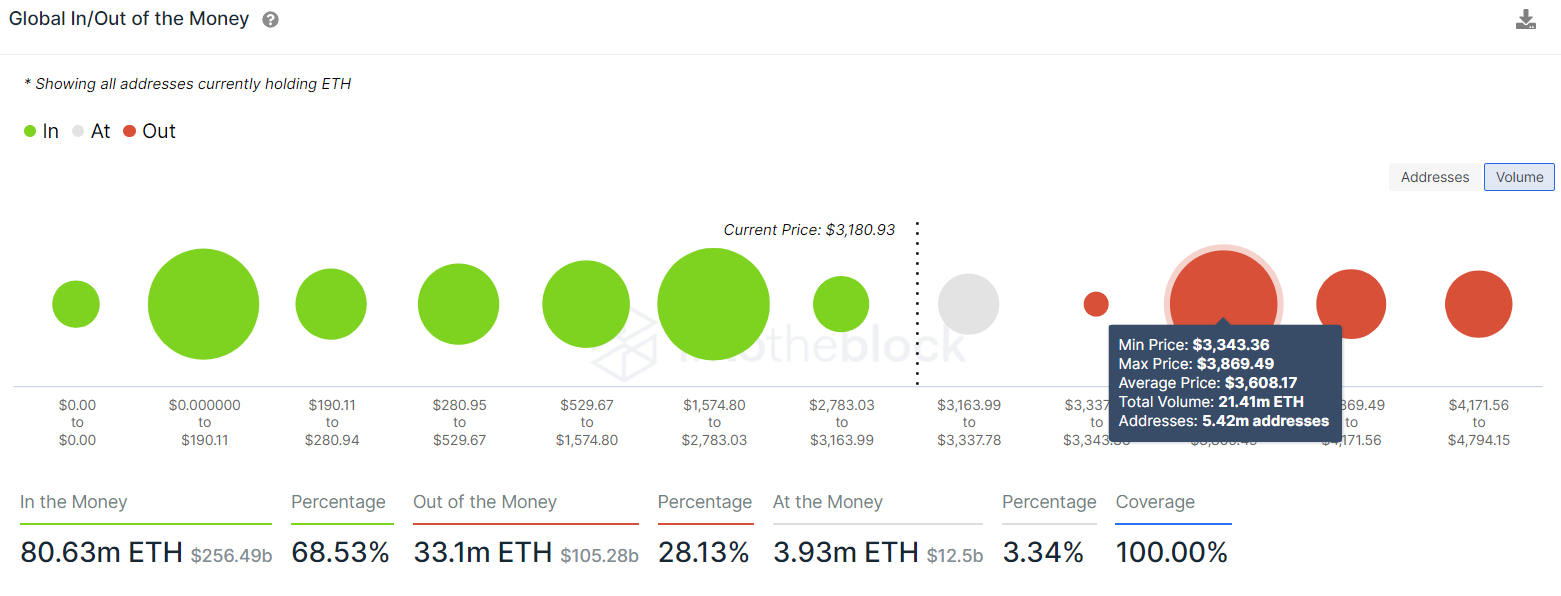
ETH GIOM
The 30-day Market Value to Realized Value (MVRV) model depicts that the uptrend originating here would be a short-term bounce. This on-chain metric is used to determine the average profit/loss of investors that purchased ETH over the past month.
This index is hovering at -10%, suggesting short-term investors that purchased ETH are experiencing a loss and are unlikely to sell. This area is called an ‘opportunity zone’ since long-term holders tend to accumulate here, triggering a reversal.
Therefore, investors can expect Ethereum price to make a U-turn around the current levels.
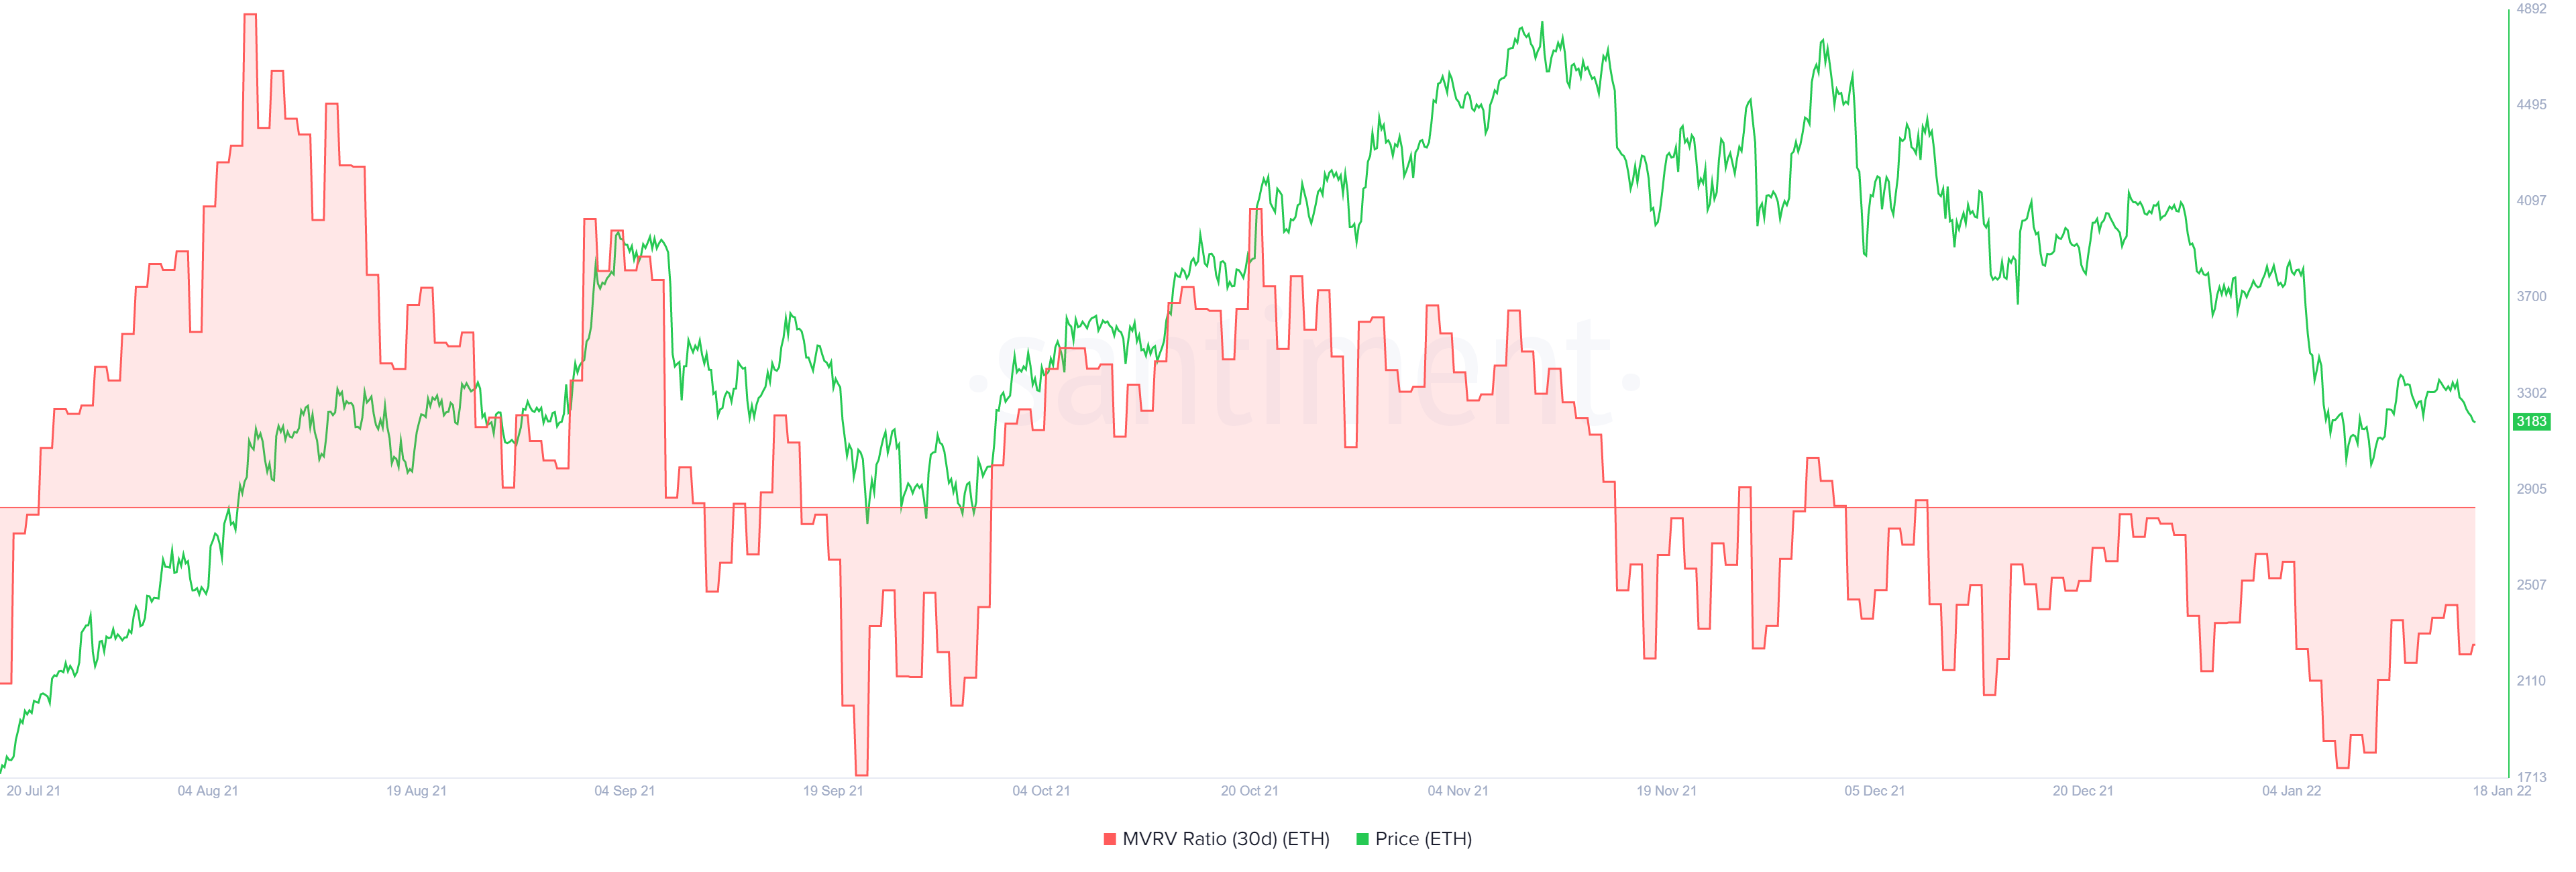
ETH 30-day MVRV
Further discouraging a massive move for Ethereum price is the recent decline in on-chain volume for ETH from 28.78 billion to 11.93 billion over the past week. This 58.5% decline indicates that investors are not interested in ETH at the current price levels and denotes an overall decline in the activity of users interacting with the Ethereum blockchain, suggesting a drop in interest.
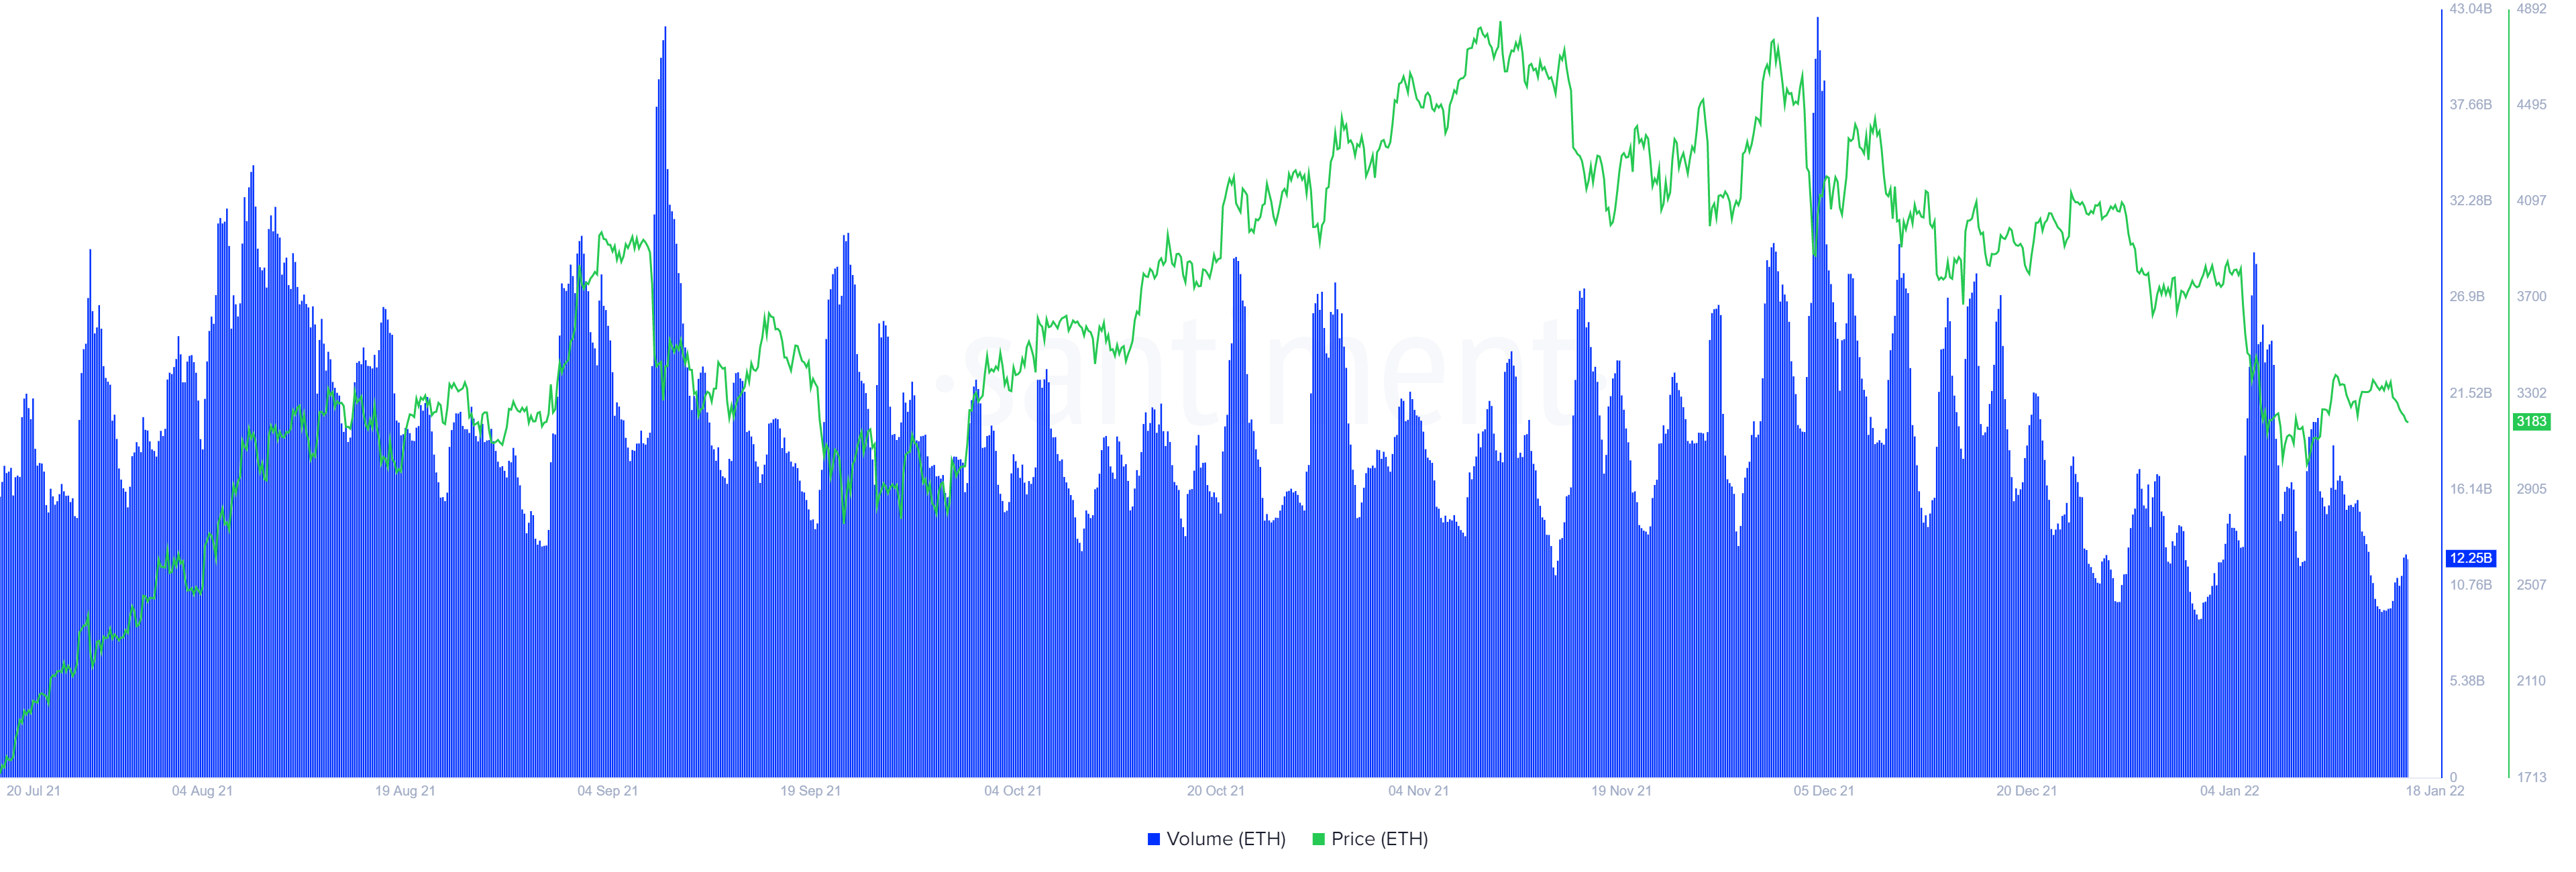
ETH on-chain volume
The declining user interest can be seen much clearer in the Network Growth chart for Ethereum price, which shows a clear downtrend from 193,000 on October 29, 2021 to 94,300 on January 17. This 51% nosedive in the number of new addresses being created on ETH suggests that investors are moving elsewhere and are not interested in the smart contract token at the current price levels.
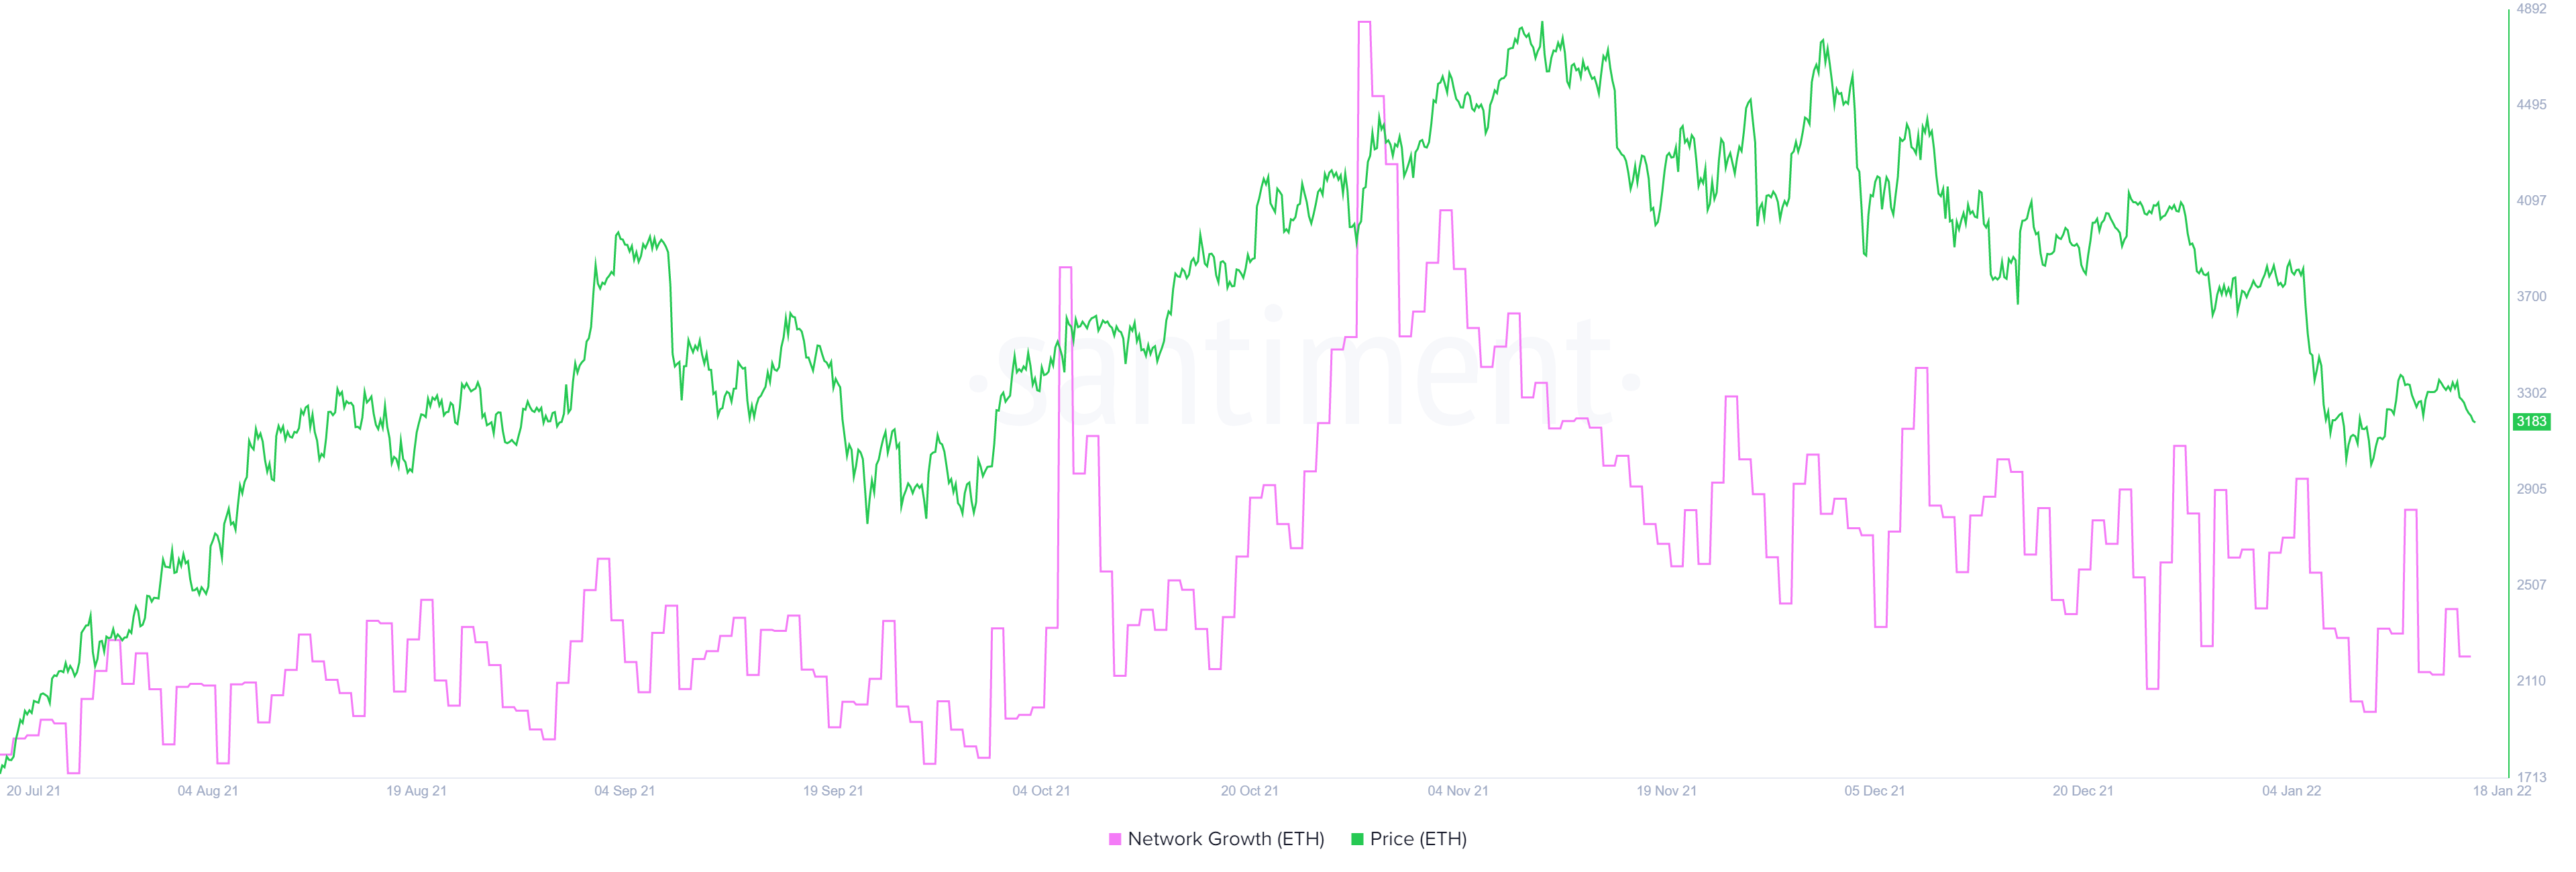
ETH network growth
While things are looking mildly bullish for ETH, a breakdown of the immediate support zone, extending from $2,927 to $3,151 will create a lower low, invalidating the bullish thesis. This development could trigger Ethereum price to crash 8% to retest the weekly support level at $2,712.
Author

Akash Girimath
FXStreet
Akash Girimath is a Mechanical Engineer interested in the chaos of the financial markets. Trying to make sense of this convoluted yet fascinating space, he switched his engineering job to become a crypto reporter and analyst.


