Ethereum Technical Analysis: ETH/USD rocketed 9% higher, but more to come
- Ethereum on Thursday is resuming bullish momentum, up with gains over 9% so far in the session.
- Near-term supply seen around $110-114 must be broken down, to allow for another wave of buying pressure. Eyes would then be on the next target, $130 territory.

ETH/USD 15-minute chart
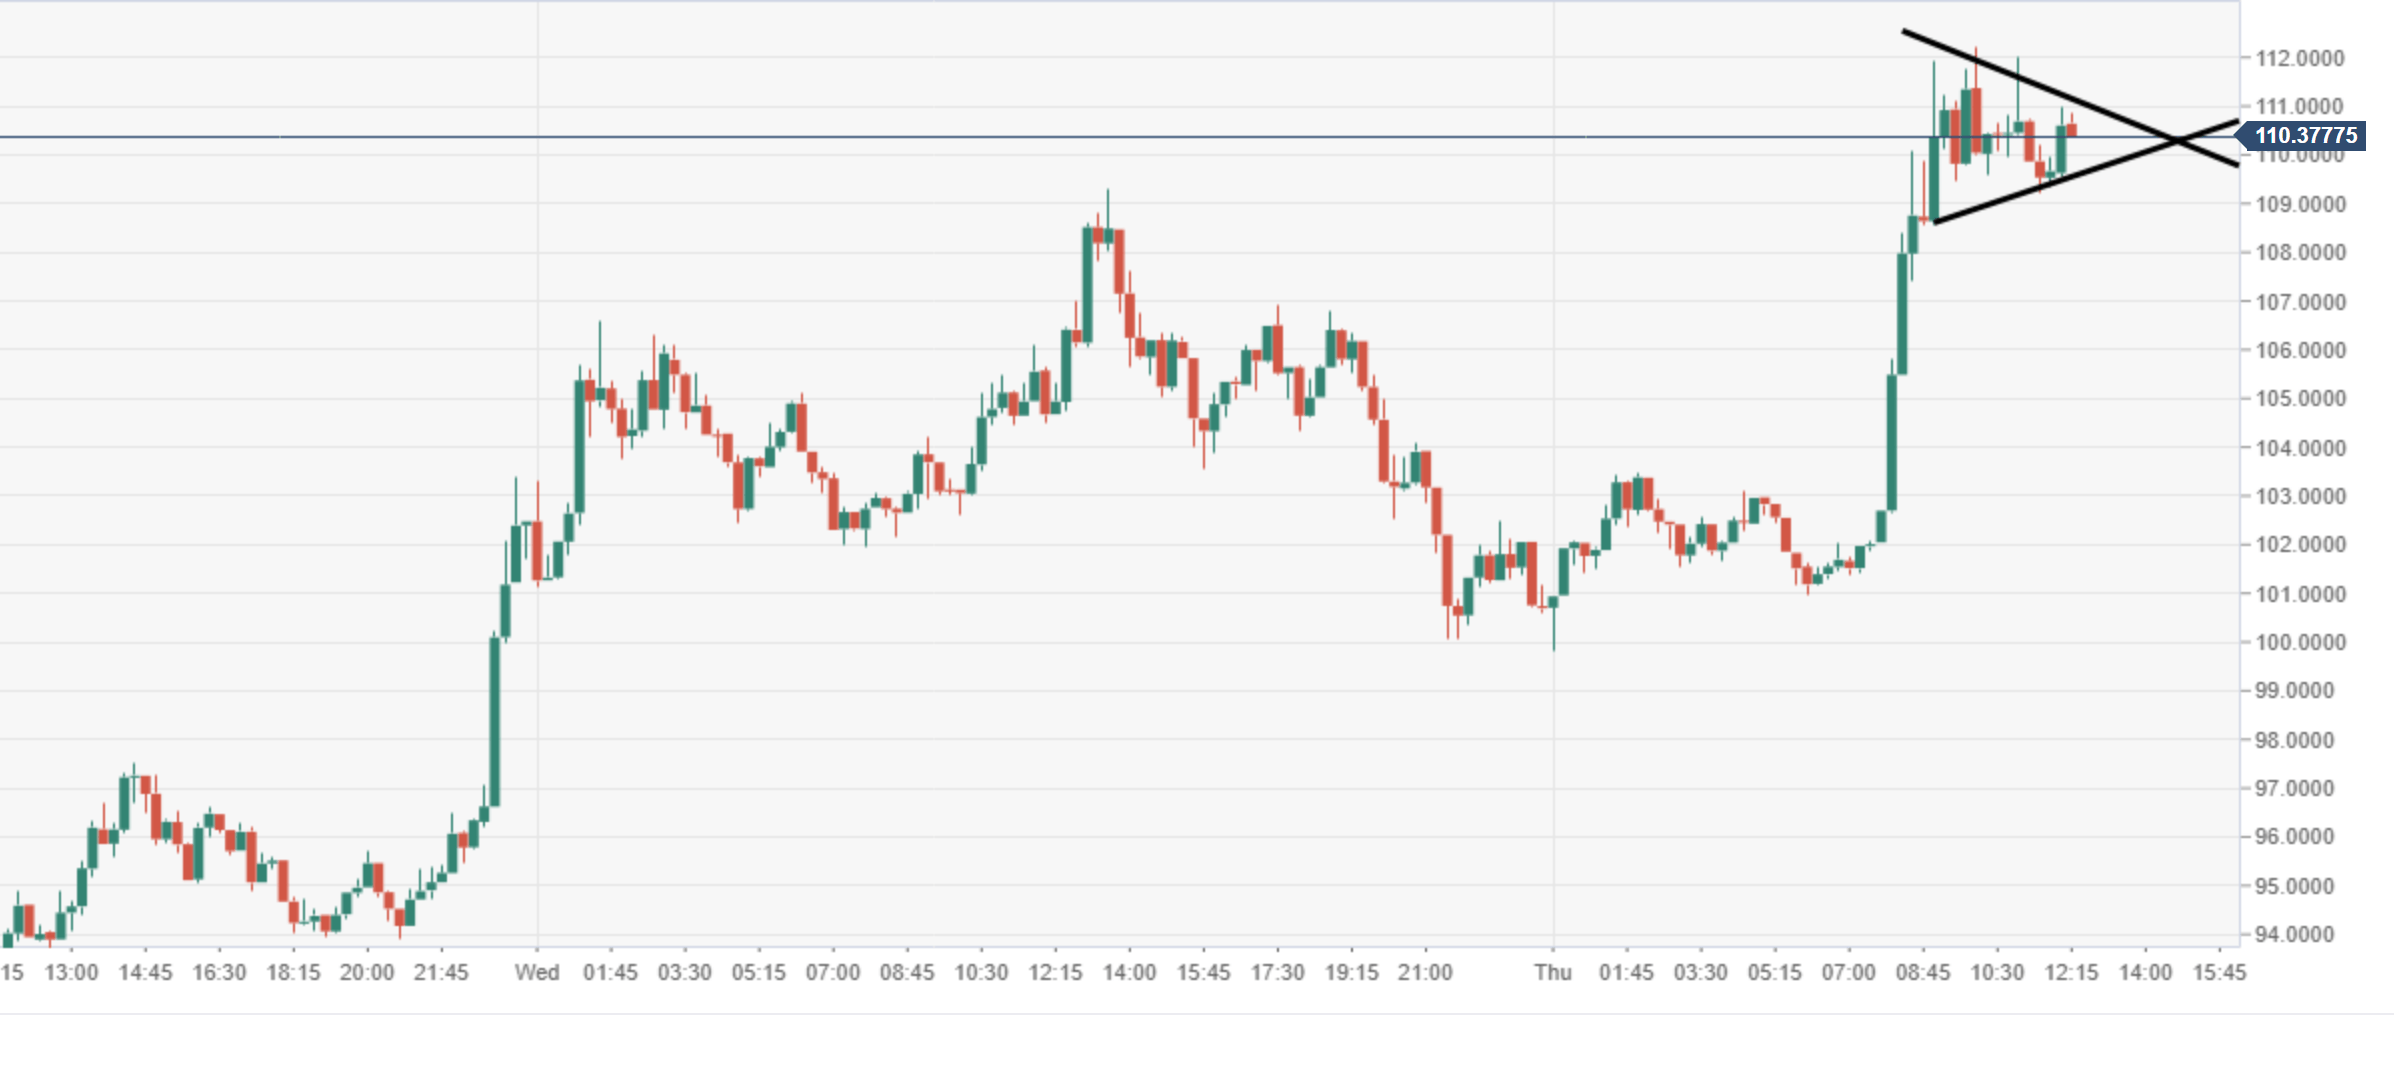
Spot rate: 109.08
Relative change: 63.45%
High: 112.23
Low: 99.83
Trend: Bullish
Resistance 1: 110.50, area of supply.
Resistance 2: 112.58, daily pivot point resistance.
Resistance 3: 115.88, daily pivot point resistance.
Support 1: 103.10, ascending near-term trend line.
Support 2: 97.40, daily pivot point support.
Support 3: 94.11, daily pivot point support.
ETH/USD 60-minute chart
- Near-term ascending trend line providing support to ETH/USD via the 60-minute. Comfort could be seen down around $103, should momentum be lost by the bulls.


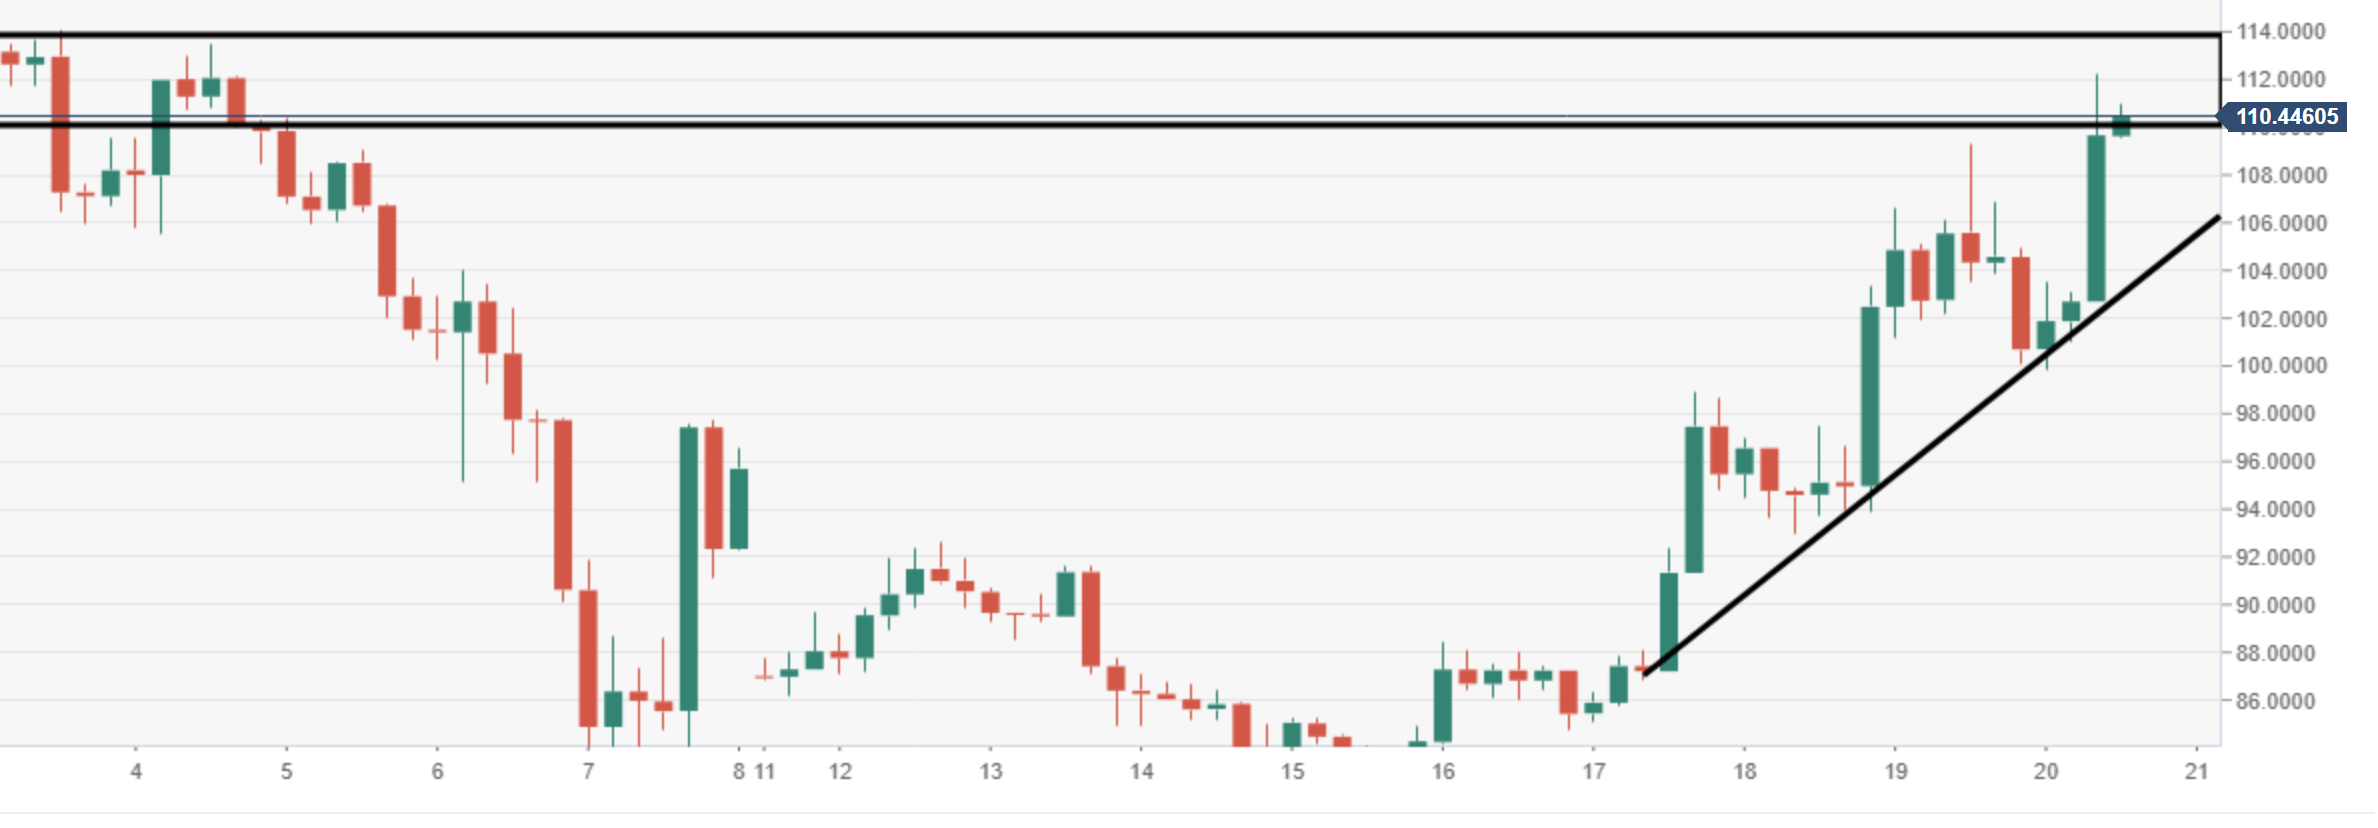
ETH/USD 4-hour chart
- For a greater wave of buying pressure, the bulls must breakdown the highlighted supply, tracking from $110-114.
Author

Ken Chigbo
Independent Analyst
Ken has over 8 years exposure to the financial markets. He started his career as an analyst, covering a variety of asset classes; forex, fixed income, commodities and equities.


