Ethereum Technical Analysis: ETH/USD bulls burst higher into positive territory
- The Etheruem price on Thursday was trading in minor positive territory into the second half of the session, up 0.10%.
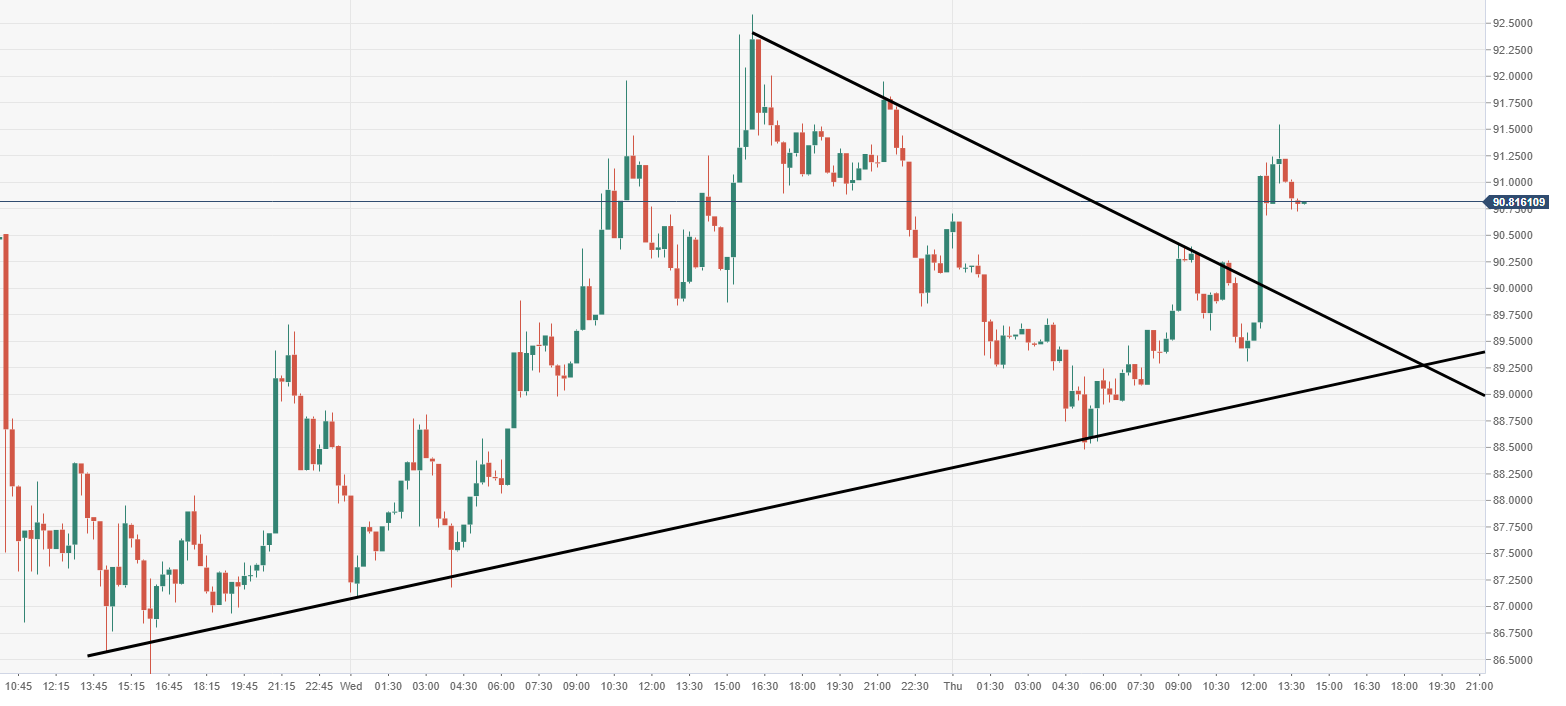
- Bulls managed to break above a descending trend line that had been containing price within recent trading, via the 15-minute chart view.
- Over the longer time frame, price action is still within a very stubborn range.

Spot rate: 90.79
Relative change: +0.10%
High: 91.54
Low: 88.54
Trend: Neutral
Support 1: 89.97, breached descending trend line.
Support 2: 87.58, daily pivot point support.
Support 3: 84.59, daily pivot point support.
Resistance 1: 92.35, near-term supply.
Resistance 2: 93.06, daily pivot point resistance.
Resistance 3: 95.57, daily pivot point resistance.
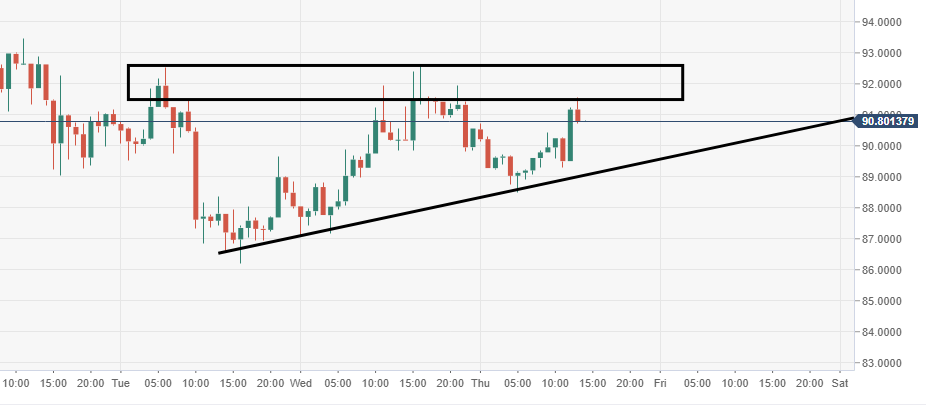
ETH/USD 60-minute chart
- Bulls have a challenge of trying to break down the highlighted stubborn supply zone, in the way of greater upside.
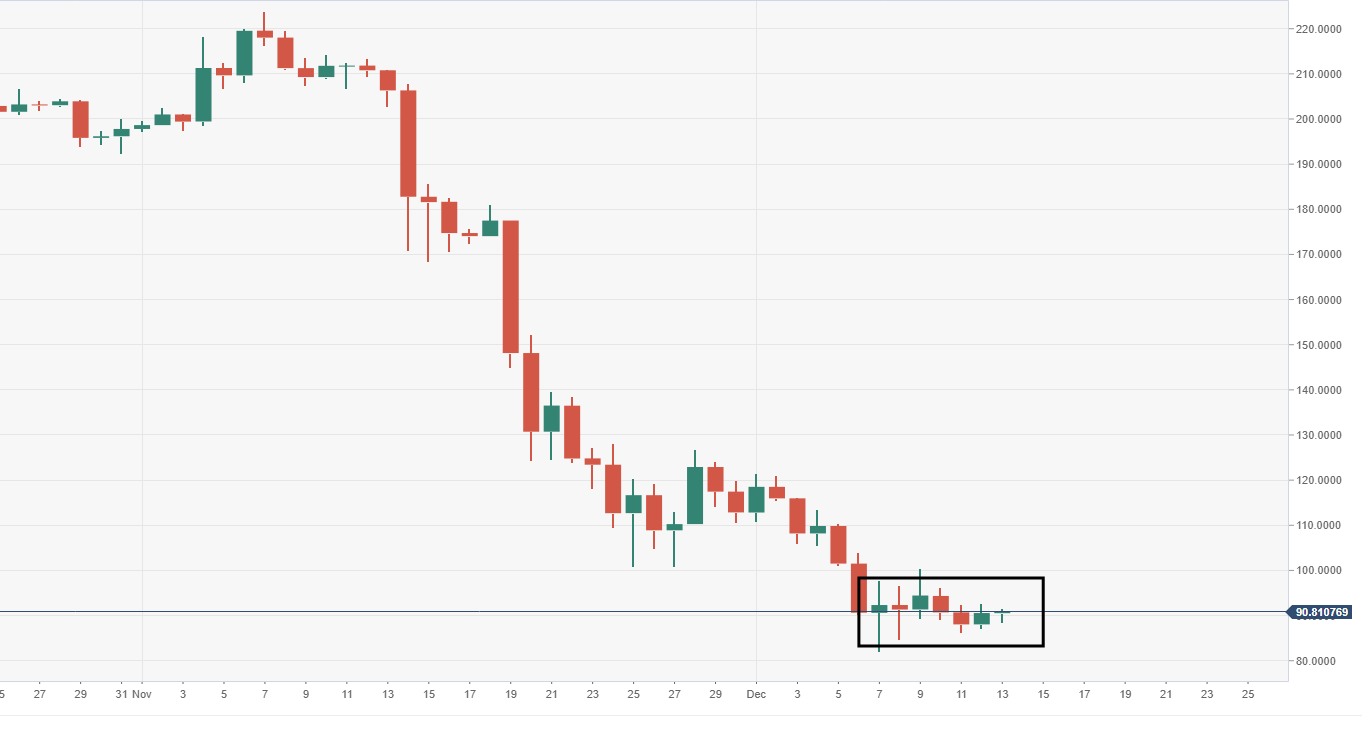
ETH/USD daily chart
- Stubborn range block, as seen across the market, proving to be a problem for both camps. Vulnerabilities remain to the downside.
Author

Ken Chigbo
Independent Analyst
Ken has over 8 years exposure to the financial markets. He started his career as an analyst, covering a variety of asset classes; forex, fixed income, commodities and equities.


