Ethereum sees revenue uptick in September amid rising inflation rate
- Ethereum revenue in September was about 4x larger than Solana's after the Fed rate cut.
- Ethereum annual inflation rate has risen to a two-year high of 0.74%.
- Ethereum has reclaimed the $2,395 support level and could rally to $2,595 if it crosses above the 100-day SMA.

Ethereum (ETH) is up over 3% on Friday as recent reports indicate its on-chain revenue growth in September amid the annual ETH inflation rate rising to a two-year high.
Ethereum's monthly revenue growth begins recovery despite growing issuance rate
Ethereum's revenue ticked up in September, exceeding that of Solana by over 3-4x, noted Swiss crypto bank Sygnum in a report on Thursday.
The top blockchain by total value locked (TVL) saw its revenue share decline steadily since the March Dencun upgrade, which "led to a degree of cannibalization of Ethereum by its Layer 2s."
Following declining on-chain activity after the market crash in August, Ethereum's revenue reached a multi-year low. DefiLlama's data shows revenue began rising again after the US Federal Reserve (Fed) cut rates by 50 basis points.
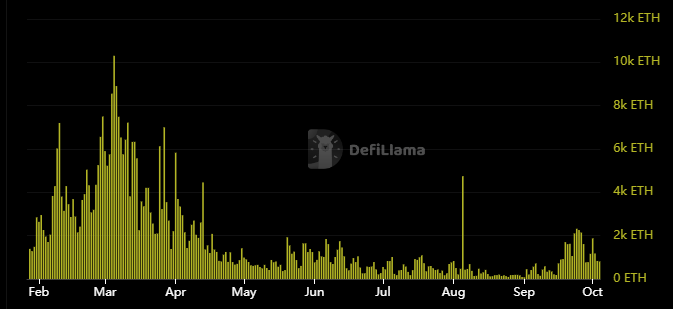
Ethereum Revenue (Source: DefiLlama)
If market activity continues to rise, Sygnum notes that L2s might benefit Ethereum in the long term.
"Although Layer 2 protocols can divert business away from the Ethereum blockchain, these cheap, scalable networks also enable activity that was not economically feasible previously. As they need to settle the final state on the main Ethereum chain, this is expected to lead to transaction and revenue growth in the long run," the bank concluded.
Ethereum co-founder Vitalik Buterin has previously expressed similar arguments, stating that the Layer 1 could make up for the fee reduction in volume through massive scalability over time.
However, in the short term, investors may be concerned as Ethereum's annual inflation rate has increased to 0.74%, per Binance Research's October 2024 Monthly Market Insights report. Binance analysts noted that ETH's issuance is at a two-year high as market share shift to L2s and low on-chain activity has reduced gas fees, which, in turn, have slowed down its burn rate.
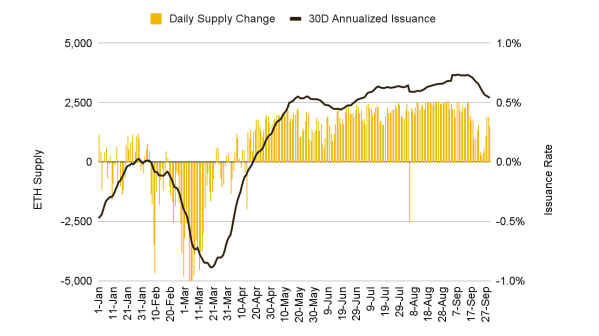
ETH Supply/Daily Issuance (Source: Binance Research)
Meanwhile, Ethereum ETFs recorded outflows of $3.2 million on Thursday, according to data from Farside Investors.
Ethereum could rise to $2,595 after reclaiming key support level
Ethereum is trading around $2,430 on Friday, up 3% on the day. In the past 24 hours, ETH has seen $20.9 million in liquidations, with long and short liquidations accounting for $9.04 million and $11.86 million, respectively, per Coinglass data.
On the 4-hour chart, ETH has reclaimed the $2,395 level after finding support near a key descending trendline. Its price may have been defended by investors who had purchased 52.3 million ETH around the $2,316 to $2,385 region—its highest demand zone, per IntoTheBlock's data.
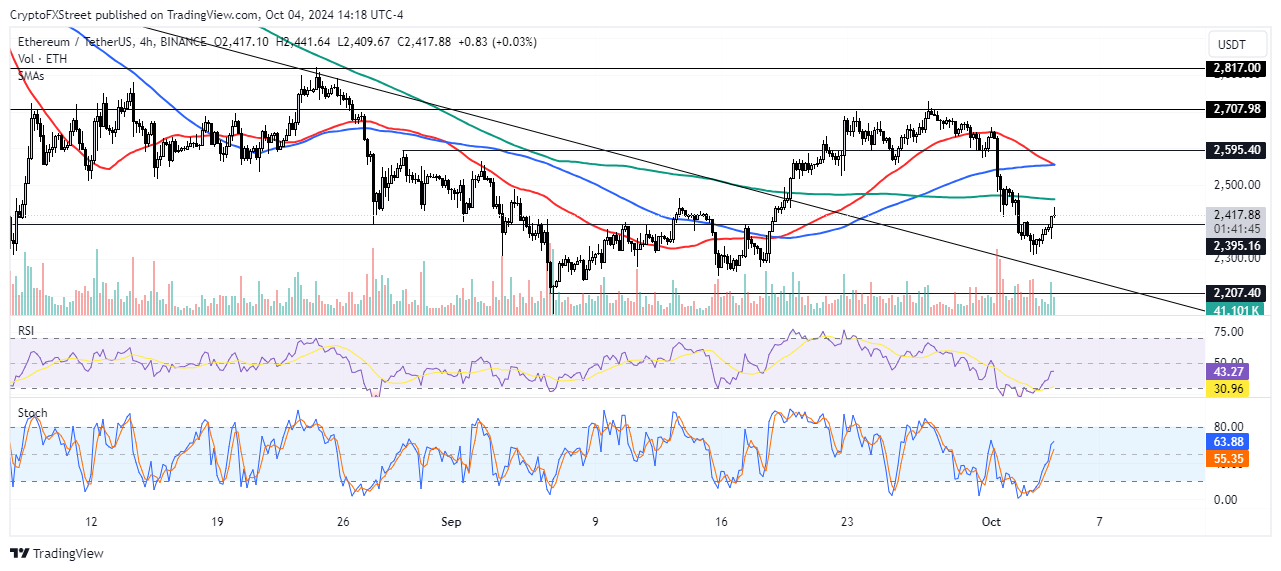
ETH/USDT 4-hour chart
ETH could rise to $2,595 if it continues the bullish move and crosses above its 100-day Simple Moving Average (SMA).
The Relative Strength Index (RSI) is approaching its neutral level, while the Stochastic Oscillator (Stoch) is trending towards the oversold region.
A daily candlestick close below $2,395 will invalidate the thesis.
Ethereum FAQs
Ethereum is a decentralized open-source blockchain with smart contracts functionality. Its native currency Ether (ETH), is the second-largest cryptocurrency and number one altcoin by market capitalization. The Ethereum network is tailored for building crypto solutions like decentralized finance (DeFi), GameFi, non-fungible tokens (NFTs), decentralized autonomous organizations (DAOs), etc.
Ethereum is a public decentralized blockchain technology, where developers can build and deploy applications that function without the need for a central authority. To make this easier, the network leverages the Solidity programming language and Ethereum virtual machine which helps developers create and launch applications with smart contract functionality.
Smart contracts are publicly verifiable codes that automates agreements between two or more parties. Basically, these codes self-execute encoded actions when predetermined conditions are met.
Staking is a process of earning yield on your idle crypto assets by locking them in a crypto protocol for a specified duration as a means of contributing to its security. Ethereum transitioned from a Proof-of-Work (PoW) to a Proof-of-Stake (PoS) consensus mechanism on September 15, 2022, in an event christened “The Merge.” The Merge was a key part of Ethereum's roadmap to achieve high-level scalability, decentralization and security while remaining sustainable. Unlike PoW, which requires the use of expensive hardware, PoS reduces the barrier of entry for validators by leveraging the use of crypto tokens as the core foundation of its consensus process.
Gas is the unit for measuring transaction fees that users pay for conducting transactions on Ethereum. During periods of network congestion, gas can be extremely high, causing validators to prioritize transactions based on their fees.
Author

Michael Ebiekutan
FXStreet
With a deep passion for web3 technology, he's collaborated with industry-leading brands like Mara, ITAK, and FXStreet in delivering groundbreaking reports on web3's transformative potential across diverse sectors. In addi


