![]() Sheldon McIntyre, CMT
Sheldon McIntyre, CMT
Independent Analyst
- Ethereum price closed Sunday with the largest weekly loss since 2016 at -41.44%.
- ETH triggers bullish hammer candlestick pattern on the 12-hour chart.
- Transition from “proof of work” to “proof of stake” highlights Ethereum’s push to be more environmentally friendly.
Ethereum price has catapulted almost 27% today after closing last week with the most significant weekly loss since trading began. At the time of writing, the 27% gain would be the largest one-day gain since December 12, 2017. There is a high probability that ETH has printed the correction low and has shifted to building a new base for a test of the all-time highs.
Musk approaches North American miners about renewable usage
On May 12, Elon Musk announced that Tesla would no longer accept BTC as a payment method after realizing that Bitcoin mining used too much energy, primarily generated from fossil fuel.
Tesla & Bitcoin pic.twitter.com/YSswJmVZhP
— Elon Musk (@elonmusk) May 12, 2021
Ethereum, the biggest rival for Bitcoin, appears to be on its way to solving the energy consumption problem by restructuring the underlying blockchain network that enables crypto transactions.
The restructure targets the proof of work system, a consensus structure that Bitcoin and Ethereum currently use to confirm transactions and add new blocks to the chain. The proof of work system needs an expansive network of computing capacity to run simultaneously every time a crypto transaction occurs, thereby generating substantial energy costs. According to the Cambridge Bitcoin Electricity Consumption Index, the current Bitcoin network supporting transactions uses more power per year than Pakistan.
Today, Elon Musk reiterated his interest in lowering energy consumption by miners by tweeting that he has engaged North American Bitcoin miners about current and planned renewable energy use.
Spoke with North American Bitcoin miners. They committed to publish current & planned renewable usage & to ask miners WW to do so. Potentially promising.
— Elon Musk (@elonmusk) May 24, 2021
Ethereum is switching to proof of stake to replace the proof of work system, where only Ether holders, not miners, are likely to be selected to confirm transactions. In proof of stake, miners invest Ether they already own, instead of footing enormous energy bills, in the race for the next set of transactions, which will be ultimately rewarded with free cryptocurrency. As a result, the only energy cost to be derived is from servers that host Ethereum nodes.
In a Bloomberg interview this weekend, Ethereum founder Vitalik Buterin said the switch to proof of stake was “more urgent for us because of how crypto and Ethereum have grown over the last year.” According to Buterin, the transition solves “one of the biggest problems of blockchain.”
It is anticipated that the ETH transition from proof of work to proof of stake will take the current use of 45,000 gigawatt hours per year and cut it to 1/10,000 of the energy.
Ethereum price full upside potential has yet to be realized
Yesterday, Ethereum price did fall below the May 19 low at $1,900 but rebounded strongly to close above the critical February high at $2,041.42. During the rebound, the smart contracts token generated a bullish hammer candlestick pattern on the 12-hour chart.
At yesterday’s low, ETH had fallen 60% from the all-time high and registered an oversold reading on the 12-hour chart.
Today, Ethereum price triggered the hammer candlestick pattern when it rallied above yesterday’s hammer high of $2,155. A 12-hour close above the candlestick preceding the hammer at $2,382 would confirm the signal.
The first technical obstacle for a continuation of the rebound is the 50-day simple moving average (SMA) at $2,797, followed closely by the double bottom trigger price of $2,999. An Ethereum price break out above $2,999 would further confirm that a long-term low has been printed in ETH.
In the race to the all-time high at $4,384, Ethereum price will strike resistance at the 61.8% Fibonacci retracement of the May correction at $3,369 and then the 78.6% retracement at $3,815.
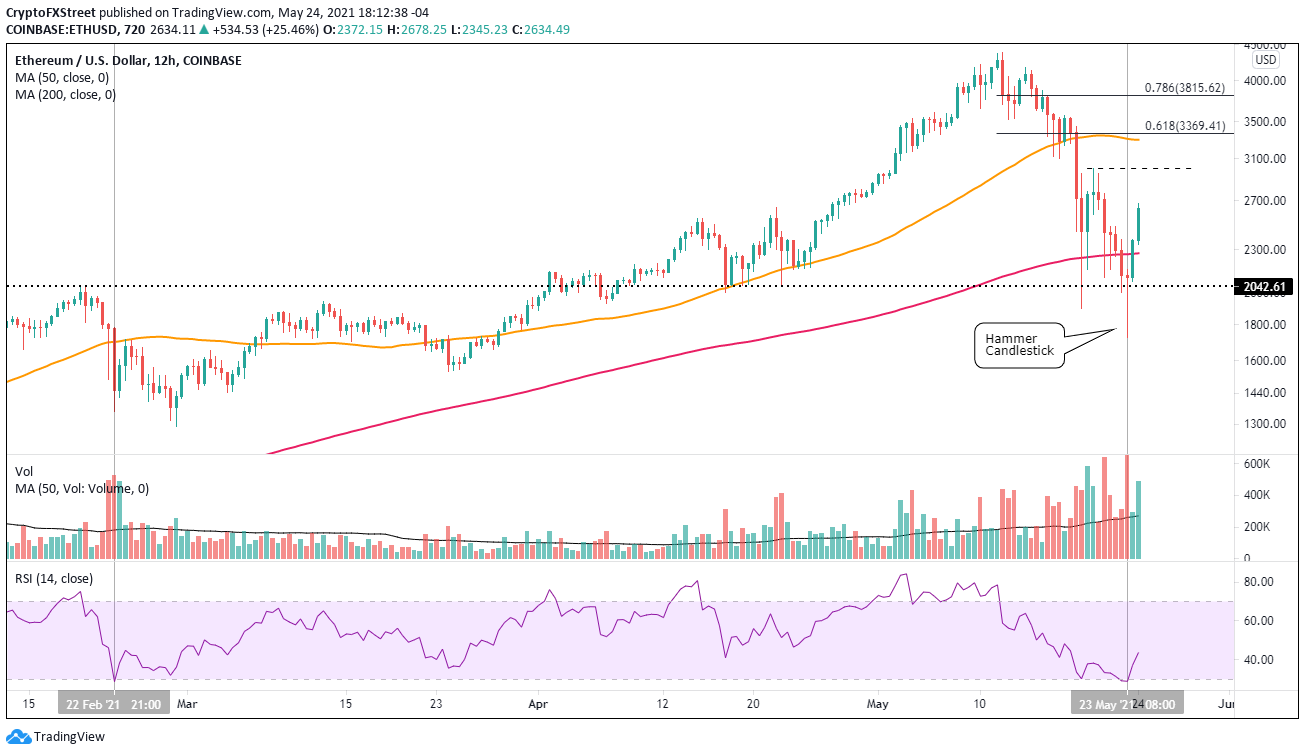
ETH/USD 12-hour chart
Another wave of selling and misfortune could drive Ethereum price back towards yesterday’s low, but the 200-day SMA would contain any additional weakness at $1,593. The current ETH outlook does not see that scenario emerging.
Note: All information on this page is subject to change. The use of this website constitutes acceptance of our user agreement. Please read our privacy policy and legal disclaimer. Opinions expressed at FXstreet.com are those of the individual authors and do not necessarily represent the opinion of FXstreet.com or its management. Risk Disclosure: Trading foreign exchange on margin carries a high level of risk, and may not be suitable for all investors. The high degree of leverage can work against you as well as for you. Before deciding to invest in foreign exchange you should carefully consider your investment objectives, level of experience, and risk appetite. The possibility exists that you could sustain a loss of some or all of your initial investment and therefore you should not invest money that you cannot afford to lose. You should be aware of all the risks associated with foreign exchange trading, and seek advice from an independent financial advisor if you have any doubts.
Recommended Content
Editors’ Picks

Bitcoin Weekly Forecast: BTC nosedives below $95,000 as spot ETFs record highest daily outflow since launch
Bitcoin price continues to edge down, trading below $95,000 on Friday after declining more than 9% this week. Bitcoin US spot ETFs recorded the highest single-day outflow on Thursday since their launch in January.

Bitcoin crashes to $96,000, altcoins bleed: Top trades for sidelined buyers
Bitcoin (BTC) slipped under the $100,000 milestone and touched the $96,000 level briefly on Friday, a sharp decline that has also hit hard prices of other altcoins and particularly meme coins.

Solana Price Forecast: SOL’s technical outlook and on-chain metrics hint at a double-digit correction
Solana (SOL) price trades in red below $194 on Friday after declining more than 13% this week. The recent downturn has led to $38 million in total liquidations, with over $33 million coming from long positions.

SEC approves Hashdex and Franklin Templeton's combined Bitcoin and Ethereum crypto index ETFs
The SEC approved Hashdex's proposal for a crypto index ETF. The ETF currently features Bitcoin and Ethereum, with possible additions in the future. The agency also approved Franklin Templeton's amendment to its Cboe BZX for a crypto index ETF.

Bitcoin: 2025 outlook brightens on expectations of US pro-crypto policy
Bitcoin (BTC) price has surged more than 140% in 2024, reaching the $100K milestone in early December. The rally was driven by the launch of Bitcoin Spot Exchange Traded Funds (ETFs) in January and the reduced supply following the fourth halving event in April.

Best Forex Brokers with Low Spreads
VERIFIED Low spreads are crucial for reducing trading costs. Explore top Forex brokers offering competitive spreads and high leverage. Compare options for EUR/USD, GBP/USD, USD/JPY, and Gold.