![]() Lorenzo Stroe
Lorenzo Stroe
Independent Analyst
- Ethereum price is contained inside an ascending triangle pattern on the 4-hour chart.
- We are a few weeks away from a potential Santa Claus rally by the end of this year.
Ethereum price has rebounded significantly during the weekend from a low price of $543 to a peak of $595. It seems that bulls maintain control and gear up for a possible Santa Claus rally by the end of 2020.
This type of rally involves a rise in an asset during the last five days of December and the next two days of January. This phenomenon was first recorded in 1972 by Yale Hirsch, the founder of the Hirsch Organization and creator of the Stock Trader's Almanac. According to recent statistics, the stock market has risen about 1.3% on average during these seven days.
Can Ethereum price really benefit from a Santa rally?
According to past price history, Ethereum price increased by 11% from December 25 until December 29, 2019, but lost almost all gains by January 2, 2020. Back to December 25, 2018, the digital asset saw a massive 21% rise until January 2, 2019.
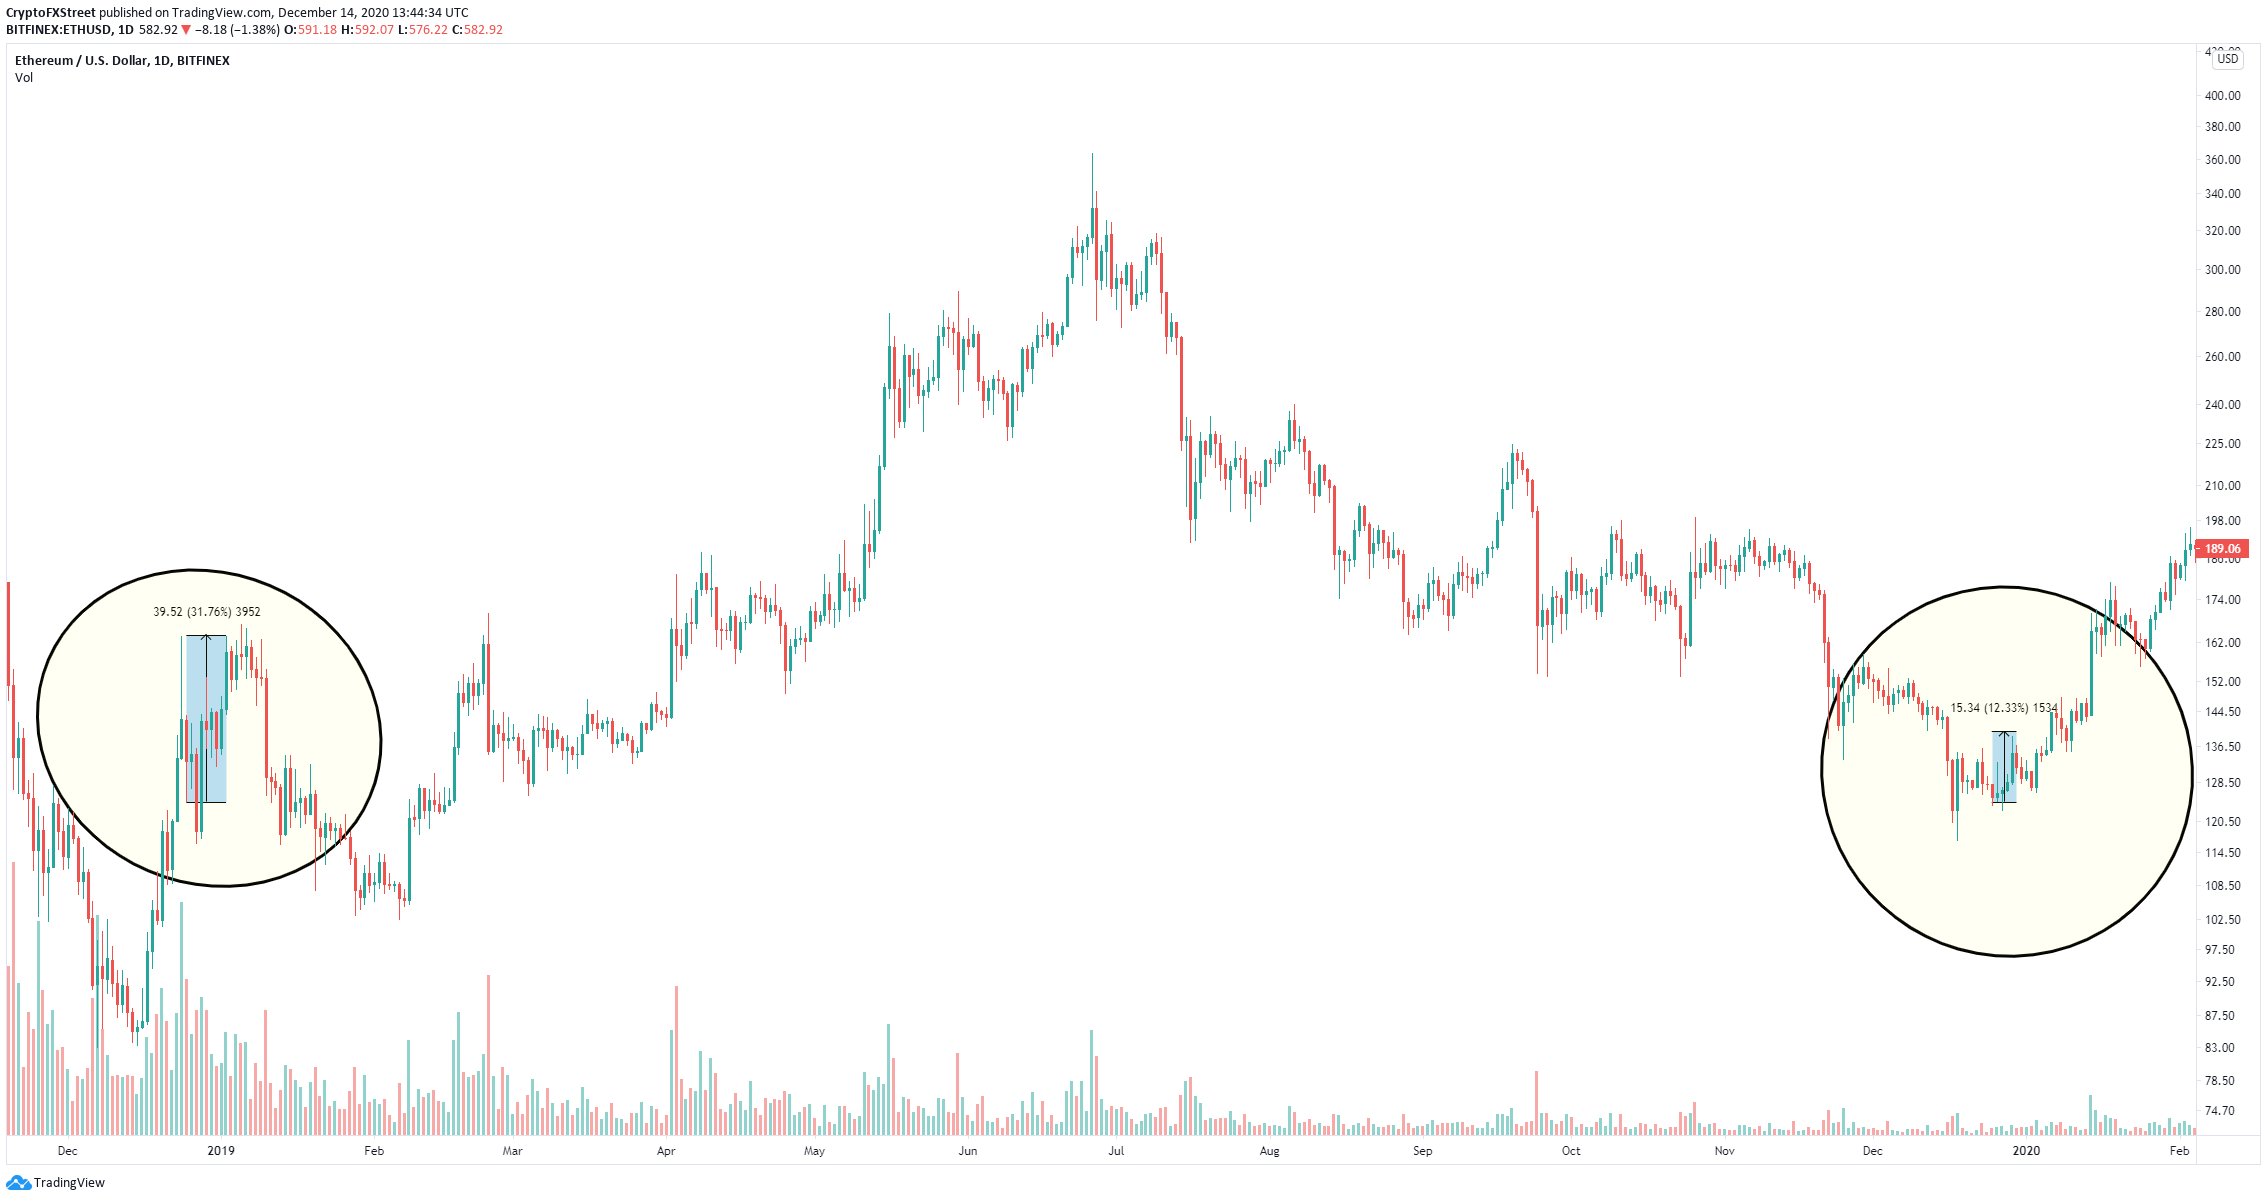
ETH/USD daily chart
Ethereum definitely seems to benefit from the last few days of December, which means we are about ten days from a possible mini-rally. On the 4-hour chart, the digital asset has established an ascending triangle pattern.
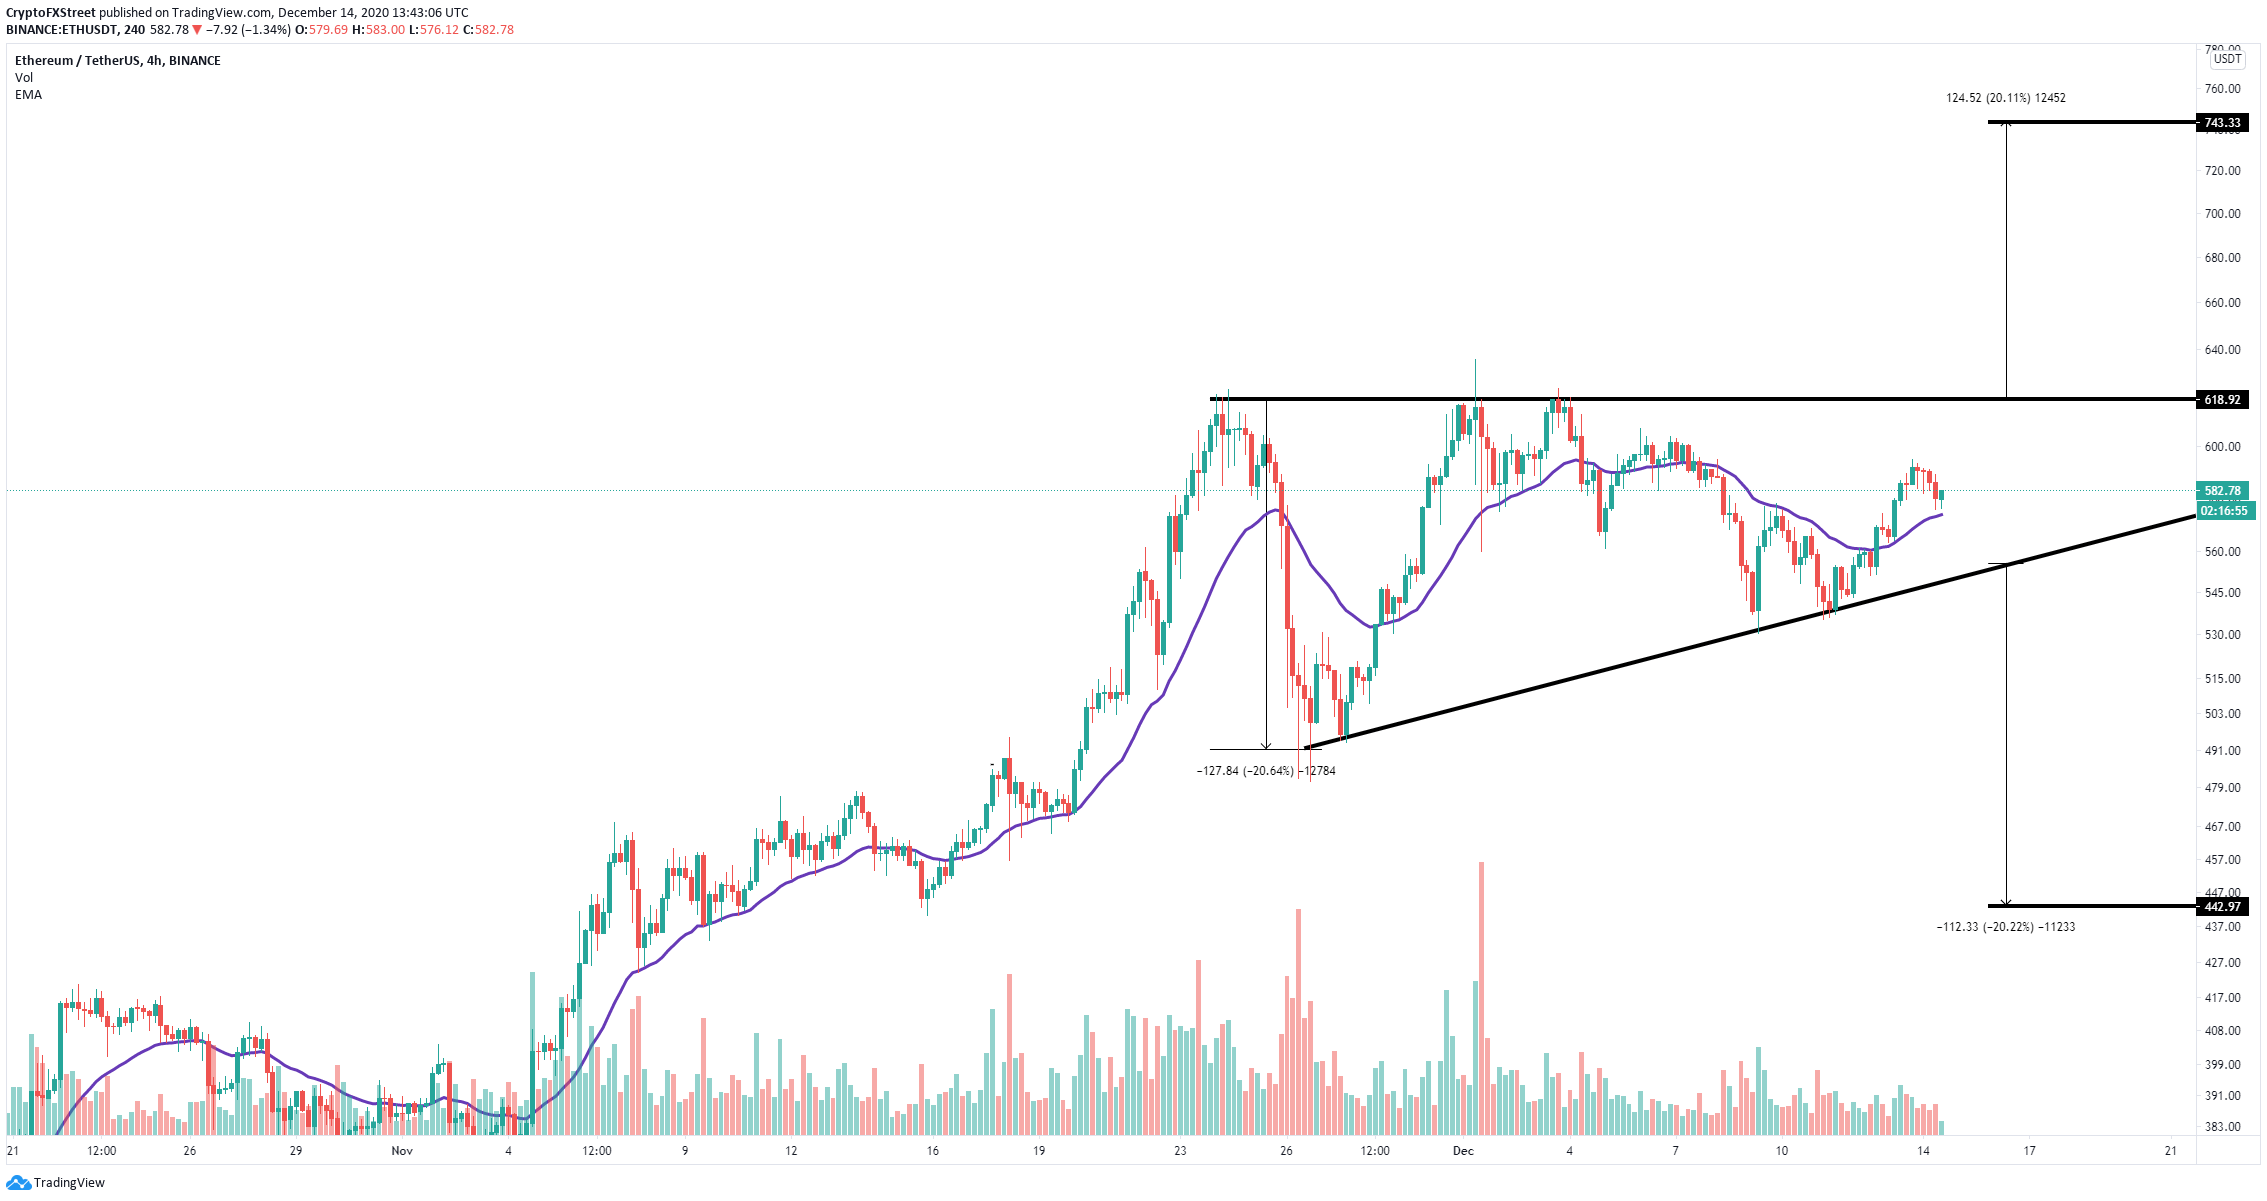
ETH/USD 4-hour chart
So far, bulls have defended the 26-EMA, which has served as a support guide in the past. A bounce from this level at $572 can easily drive Ethereum price towards the top of the pattern at $619. A breakout above this point would push ETH to a high of $743.
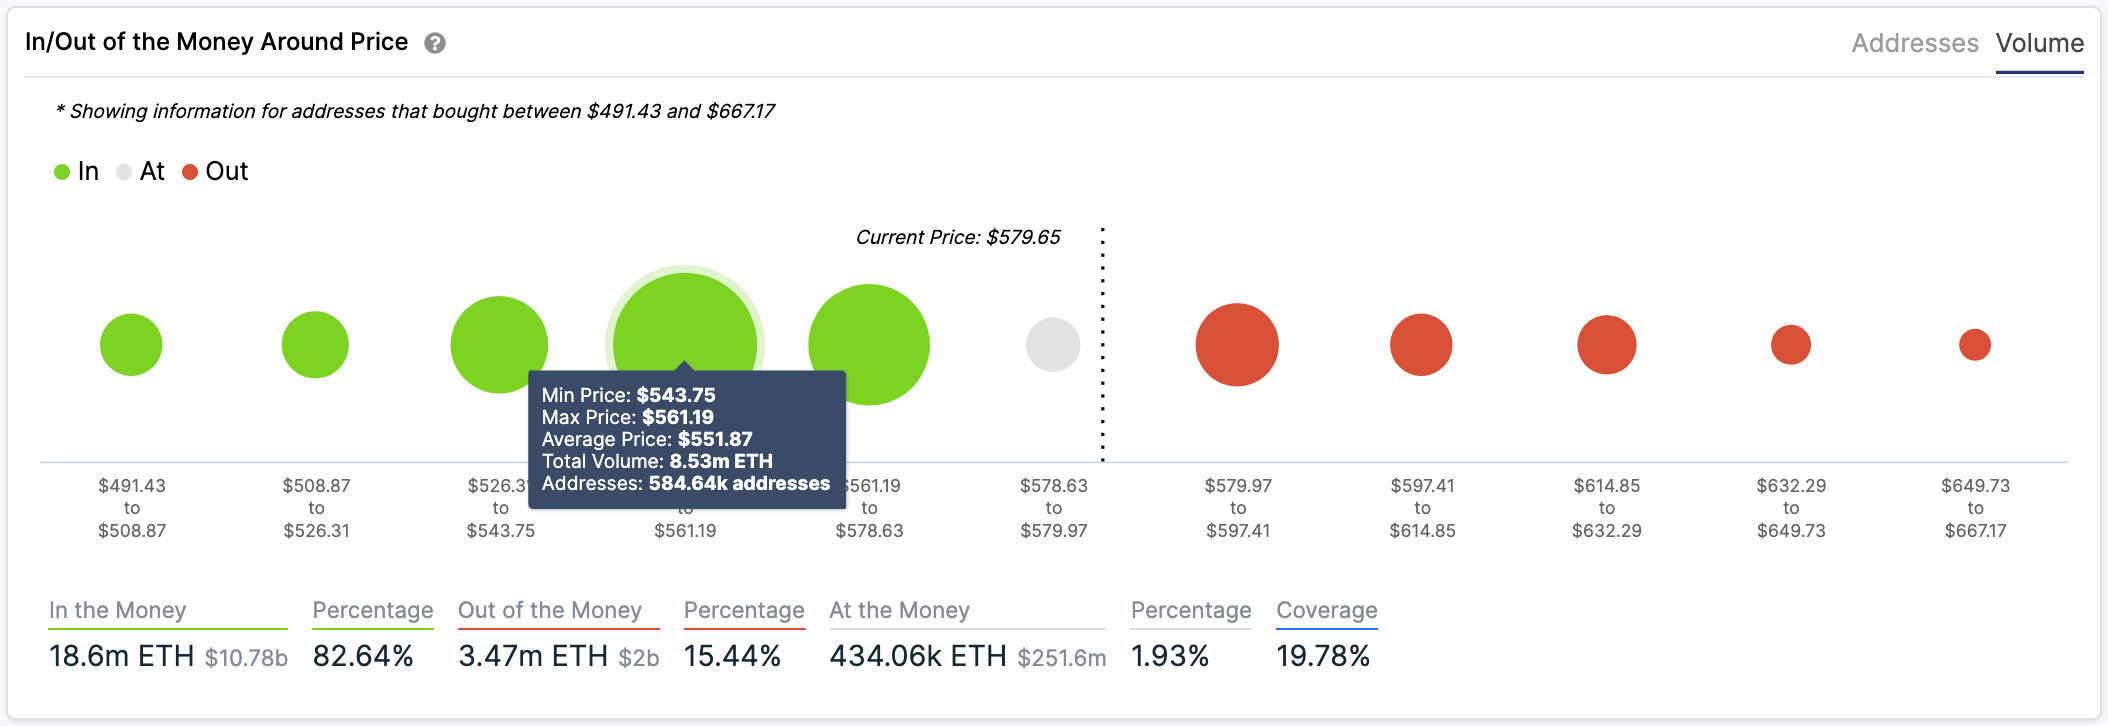
ETH IOMAP chart
According to the In/Out of the Money Around Price (IOMAP) chart, there is a lot of support on the way down below $580 but feeble resistance ahead, which favors the bulls as they face practically no opposition until $670.
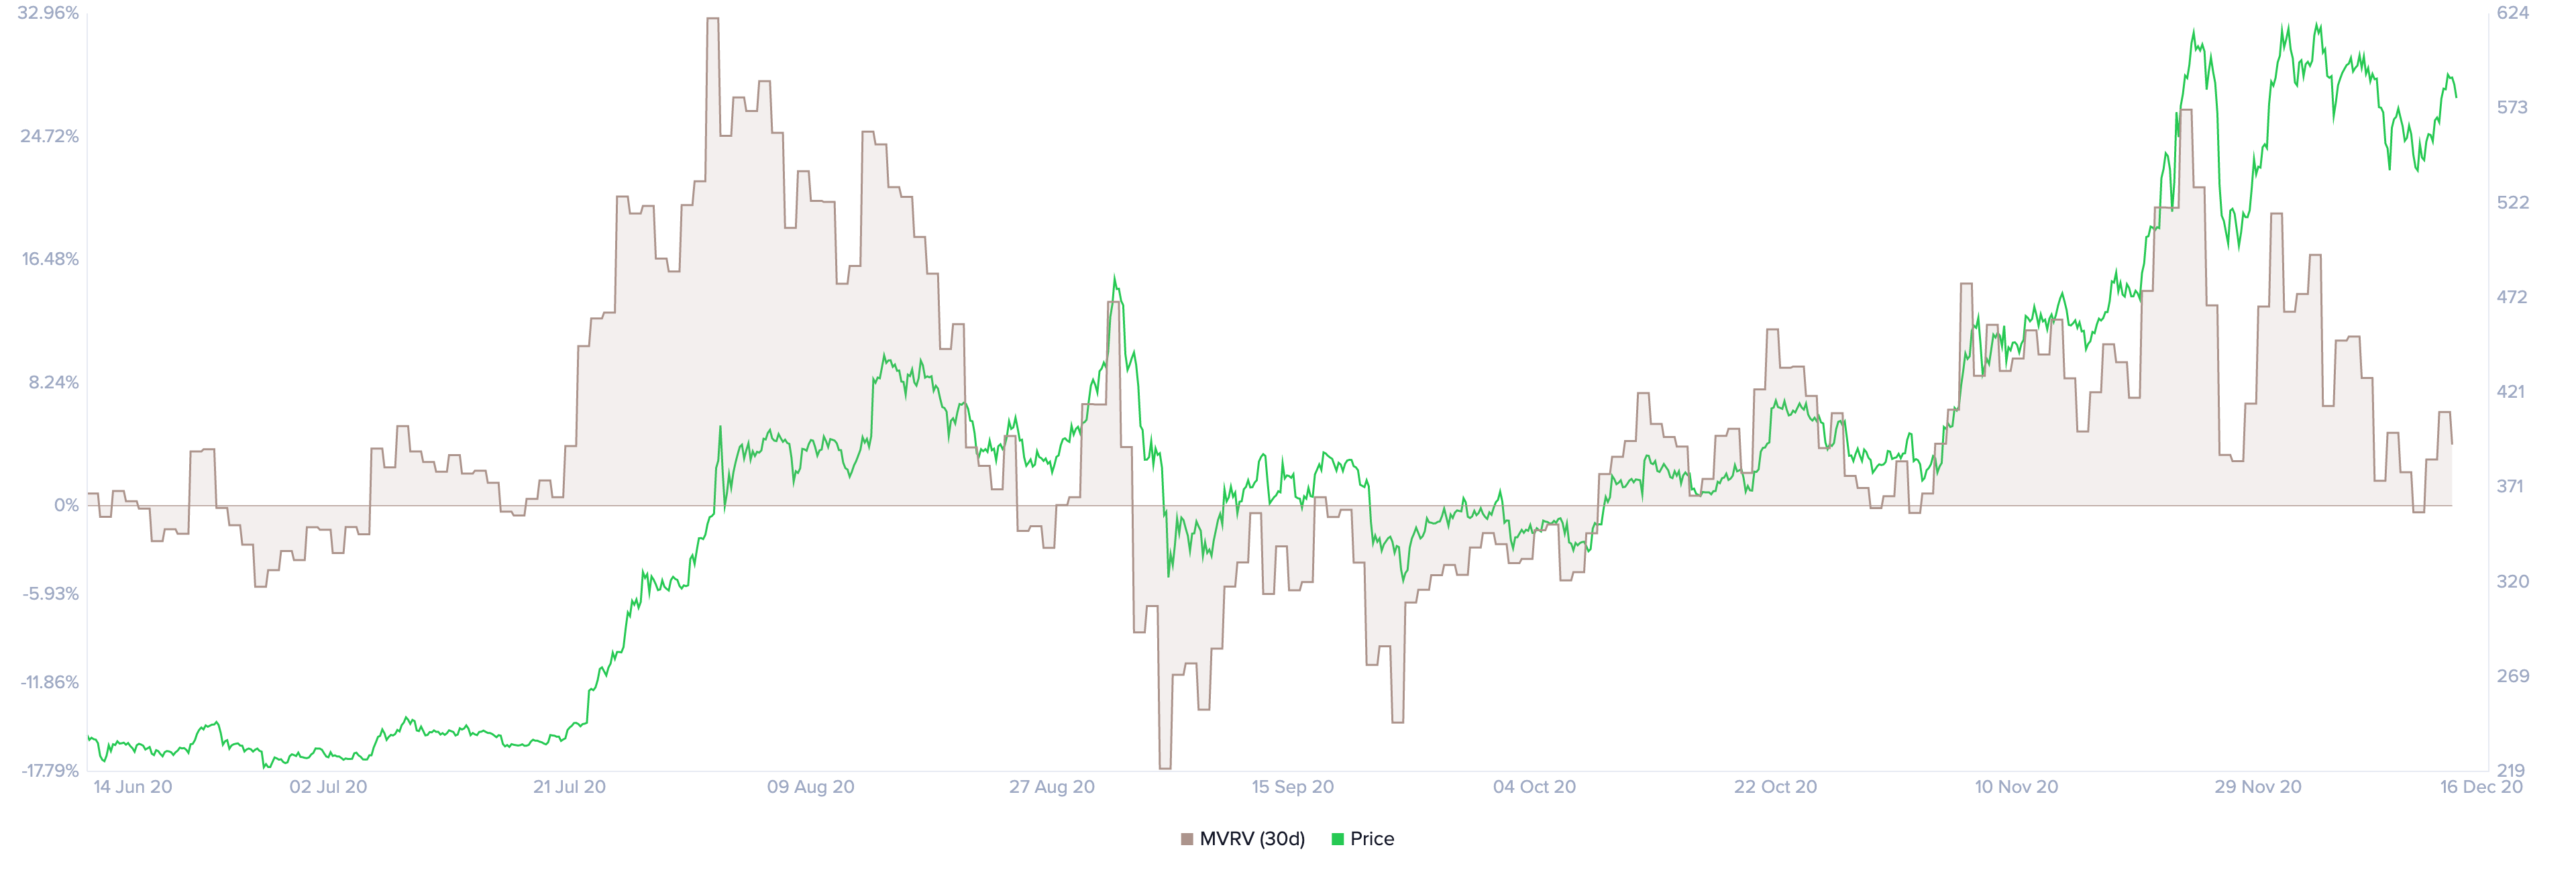
ETH MVRV chart
Other on-chain metrics also give the bulls better odds in the short-term. The MVRV ratio has recently touched the buy zone, which is usually an accurate indicator for future investors looking to get into an asset.
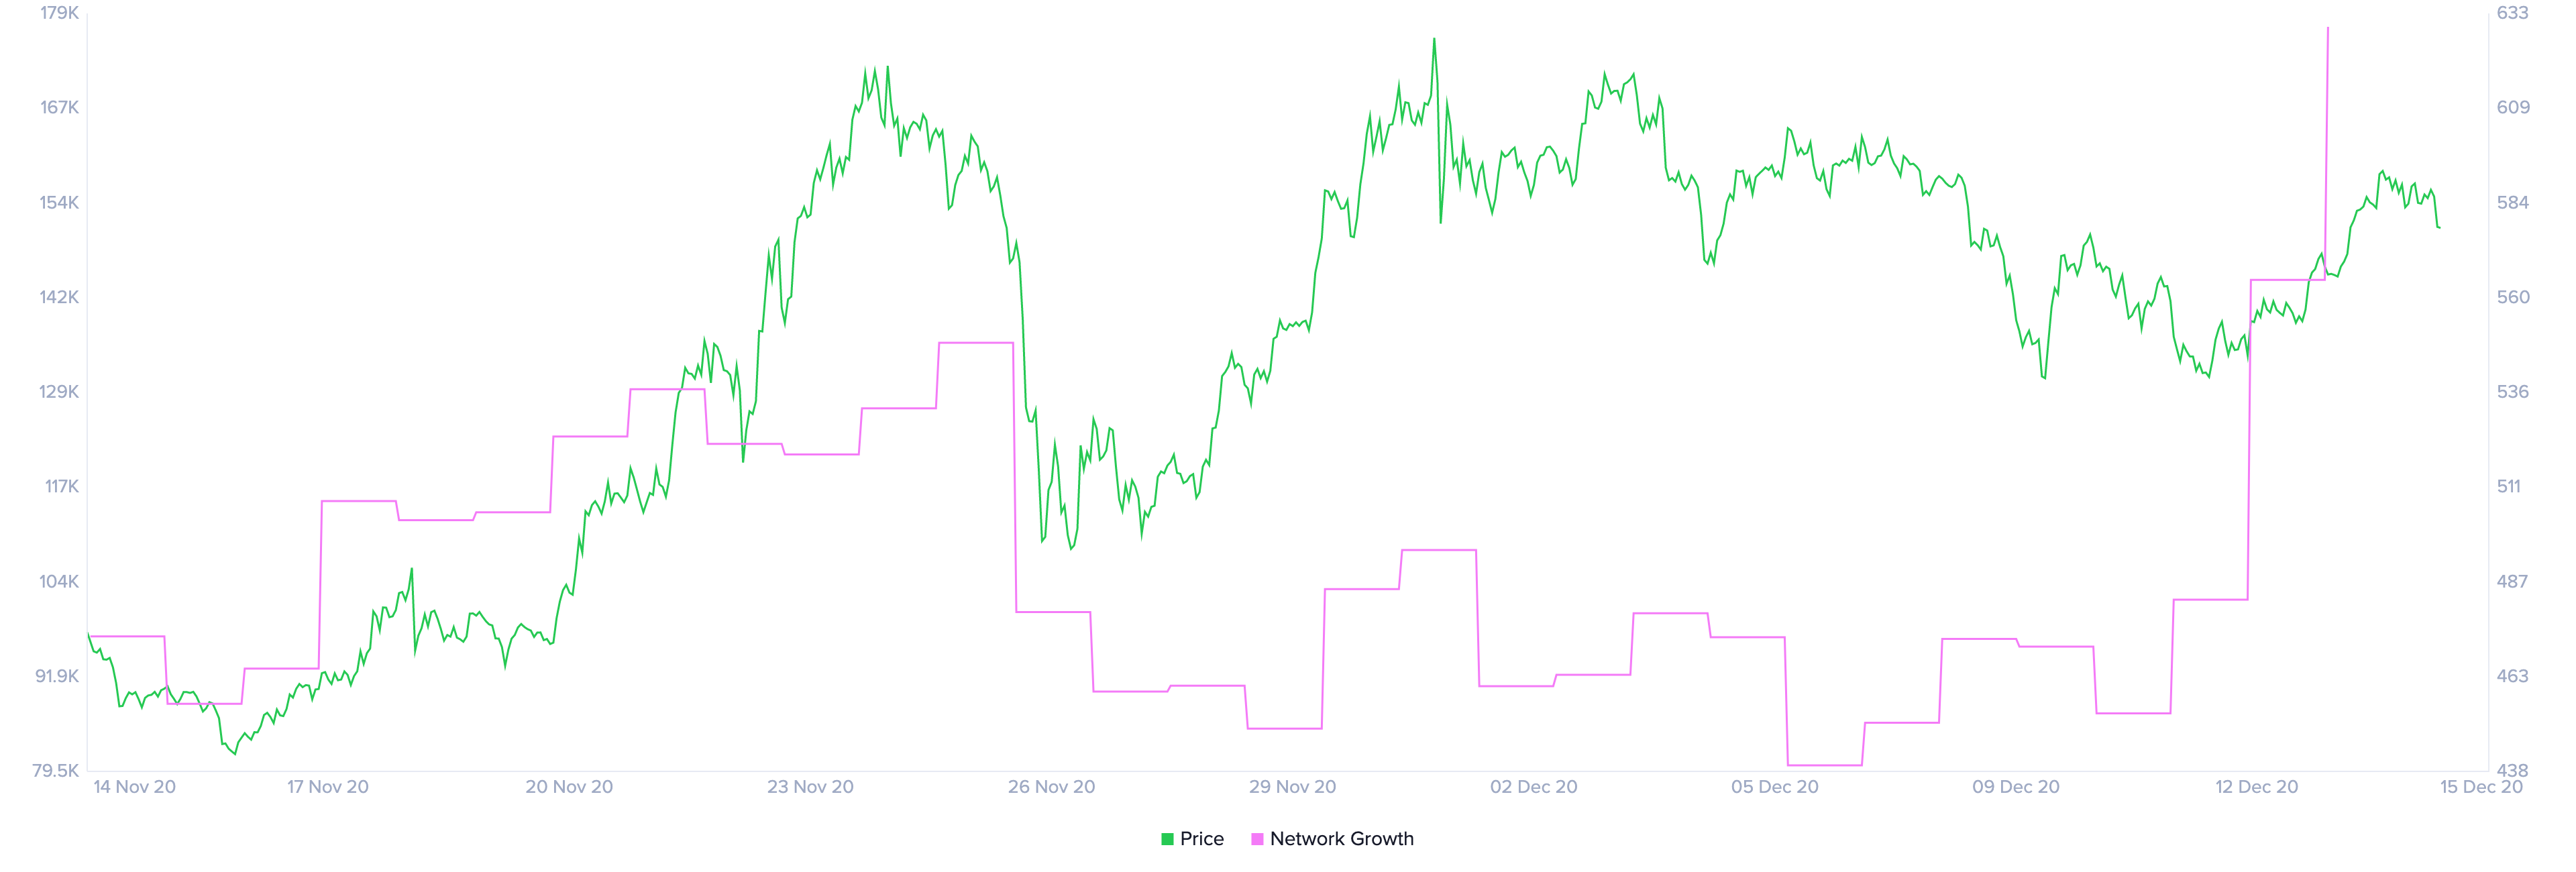
ETH Network Growth chart
Additionally, the number of Ethereum coins locked inside the Eth2 deposit contract continues rising at 1,468,513, representing 1.3% of the total supply. Furthermore, the digital asset has also experienced a significant spike in its network growth, which indicates new investors are highly interested in it.
However, despite all the bullish factors in favor of Ethereum, a breakdown below the support trendline of the ascending triangle pattern at $550 would drive Ethereum price towards a low of $442.
Note: All information on this page is subject to change. The use of this website constitutes acceptance of our user agreement. Please read our privacy policy and legal disclaimer. Opinions expressed at FXstreet.com are those of the individual authors and do not necessarily represent the opinion of FXstreet.com or its management. Risk Disclosure: Trading foreign exchange on margin carries a high level of risk, and may not be suitable for all investors. The high degree of leverage can work against you as well as for you. Before deciding to invest in foreign exchange you should carefully consider your investment objectives, level of experience, and risk appetite. The possibility exists that you could sustain a loss of some or all of your initial investment and therefore you should not invest money that you cannot afford to lose. You should be aware of all the risks associated with foreign exchange trading, and seek advice from an independent financial advisor if you have any doubts.
Recommended Content
Editors’ Picks

Ethereum Price Forecast: ETH ETFs post first weekly inflows since February
Ethereum ETFs recorded net inflows of $104.1 million on Friday — their highest daily inflow since February 4, per SoSoValue data. As a result, the products saw a weekly net inflow of $157.1 million, which also marks their highest net buying activity since February.

Defi Development Corporation files to offer $1 billion in securities to boost its Solana holdings
Defi Development Corporation filed a registration statement with the Securities & Exchange Commission on Friday, signaling its intent to offer and sell a wide range of securities.

Bitwise hints at NEAR ETF following Delaware registration
The filing marks a crucial step before a firm submits an application for an ETF with the SEC. While Bitwise has not yet applied for a NEAR ETF with the SEC, similar actions preceded its previous XRP and Aptos ETF filings.

Bitcoin price could reach $285K by 2030 as Citigroup forecasts $1.6 trillion stablecoin inflows
Bitcoin price outlook strengthens as Citigroup projects $1.6 trillion stablecoin growth, calling them critical bridges between banks and blockchain.

Bitcoin Weekly Forecast: BTC consolidates after posting over 10% weekly surge
Bitcoin (BTC) price is consolidating around $94,000 at the time of writing on Friday, holding onto the recent 10% increase seen earlier this week.

The Best brokers to trade EUR/USD
SPONSORED Discover the top brokers for trading EUR/USD in 2025. Our list features brokers with competitive spreads, fast execution, and powerful platforms. Whether you're a beginner or an expert, find the right partner to navigate the dynamic Forex market.